 United States


|
“Buying low and selling high” might not work as well as you think in high yield
We back-tested several hypothetical high yield range trading strategies – all designed to “buy low and sell high”. Each buys the index1 when spreads widen to a historically high trigger level (such as 640bp – the 75th percentile) and sell into cash when spreads tighten to a lower trigger level (such as 340bp – the 25th percentile).
We found multiple variations on these strategies consistently underperformed the simpler practice of buying the index and holding it over the long term (Figure 1).
Figure 1: Timing high yield entry and exit points has seldom offered any value (hypothetical results)
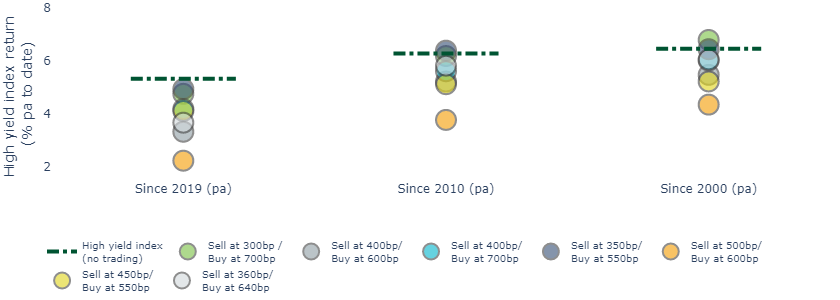
Source: Bloomberg. insight, March 2024. Past performance is not indicative of future results. Investment is any stratergy involves a risk of lass which may partly be due to exchange rate fluctuations.
The one strategy that did (only just) outperform since 2000 is captured by the light green bubble. It buys when spreads hit 700bp and sells at 300bp. It benefited from being invested in cash instead of the high yield market during the rate hikes of the last two years.
Nonetheless, things change when we also factor transaction costs, which are ~20bp pa by our estimates. Simply holding the index likely becomes the highest returning strategy historically.
The 350bp / 550bp strategy, chosen for its proximity to the median average spread of ~450bp, was also close to matching the index. However, it likely would have suffered even more from trading costs given its relatively narrow trading band.
Other strategies, such as trading the 75th and 25th percentiles (light grey bubble), consistently underperformed.
How can “buying low and selling high” not guarantee the best returns?
A trading strategy may deliver capital gains over time, but credit asset returns are far more influenced by income. Since 2000, the high yield index had returned ~6.4% in total, with +7.7% coming from income and -1.3% from price moves.
You need to be invested to harvest income.
To us, the takeaway is clear: Time in the market beats timing the market.
Credit spreads may not be as tight as they first seem
High yield credit spreads are the tightest they have been since early 2022. However, it makes sense to us that spreads should be structurally narrower than they were earlier in the millennium.
The credit quality of the high yield index has improved: ~46% of the index is BB today whereas only ~34% was in 2000 (Figure 2).
Figure 2: The credit quality within high yield has generally improved over time
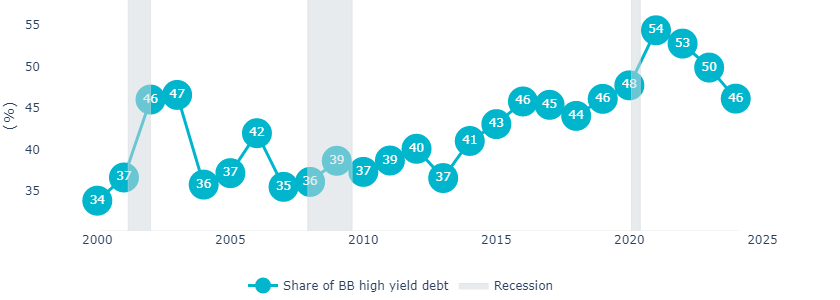
Source: Bloomberg, Insight, March idea2024. Past performance is not indicative of future results. Investment in any strategy involves a risk of loss which may partly be due to exchange rate fluctuations.
High yield spreads also have less need to reflect a sizeable “illiquidity premium”. Following the 2008 crisis, two-way liquidity suffered for those trading bonds over-the-counter. However, the rise of the fixed income ETF trading since then (and the development of credit portfolio trading) has vastly improved the market’s liquidity for certain market participants.
Spreads offer ample compensation for credit risks in our view
By our calculations, the high yield index’s historical default rate is 2.5% pa on average since 2005, and the historical recovery rate is 46%2. If we project average default losses into the next 12 months, it implies that the contractual yield on high yield bonds (currently 7.8% pa) would fall to ~6.5% net of defaults. This is still a fair bit higher than the yields on BBB and investment grade credit indices (Figure 3).
Figure 3: The credit quality within high yield has generally improved over time
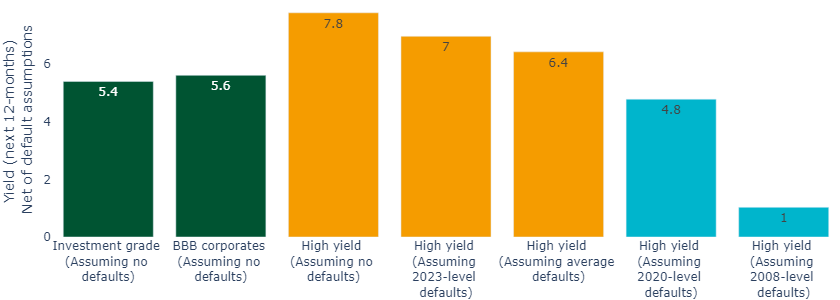
Source: Bloomberg US Corporate Investment Grade Index, Bloomberg US Corporate BBB Index, Bloomberg Corporate High Yield Index, Insight calculations, March 2024. Past performance is not indicative of future results. Investment in any strategy involves a risk of loss which may partly be due to exchange rate fluctuations.
Defaults would potentially need to rise to levels previously only seen in deep recessions, such as 2020 or 2008, for the net realized yield to slip below investment grade levels over the next 12 months. However, we see a shallow recession as unlikely (and a deep one as highly unlikely). We project the economy will deliver a “soft landing”, given factors such as a healthy consumer, relatively low household and corporate leverage and robust nominal GDP growth.
Defaults may already be reflected in market pricing
Defaults have been meager over the last three years at (1.51% in 2023, 0.69% in 2022 and 0.25% in 2021)2. Nonetheless, we do expect them to creep up closer to historically average annual levels (around ~2.5%) over the coming years.
In our view, this is already more than reflected in market pricing, which is flagging increased distress down the ratings spectrum (Figure 4). As such, we think normalization of defaults is not likely to be catalyst for wider credit spreads.
Figure 4: Market pricing already reflects a normalization of default risks
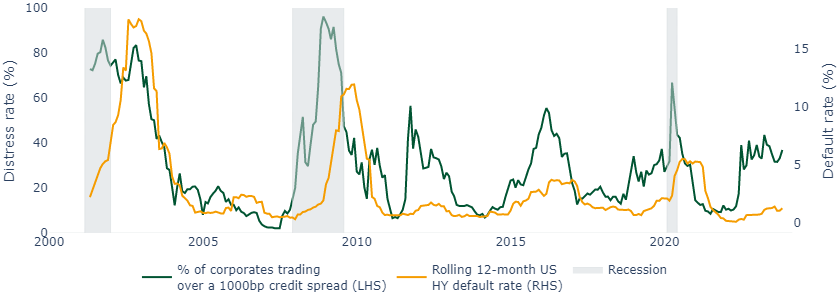
Source: Bloomberg US Corporate High Yield Index, Insight calculations, March 2024
All-in yields are still compelling
All-in yields in high yield are still close to their post-pandemic highs, even if spreads are historically tight.
When the Federal Reserve instituted a “zero interest rate policy” (ZIRP), credit spreads often accounted for 80% to 90% of all-in-yields. In today’s higher interest rate world, spreads account for ~40% of yields.
This is a healthier balance in our view, as spreads and yields tend to move counter to each other, providing a mutual stability buffer. When spreads widen, government bond yields tend to fall (as central banks often act to ease financial conditions to reduce economic stress). When interest rates rise, spreads have often tightened historically, as rising rates often reflect economic strength.
Those waiting for spreads to widen may find that, even it occurs, falling government yields may blunt the impact on all-in yields.
Figure 5: All-in yields remain compelling in our view
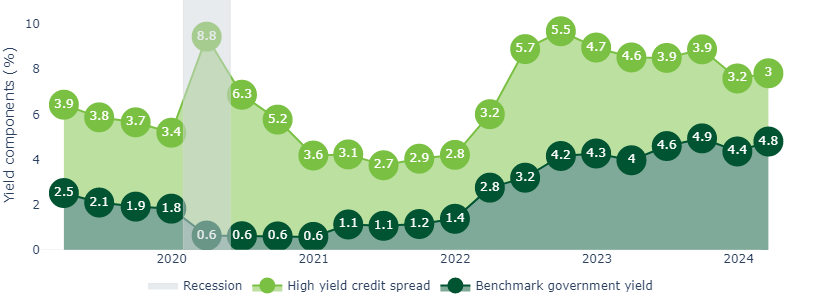
Source: Bloomberg Corporate High Yield Index, Insight, March 2024. Past performance is not indicative of future results. Investment in any strategy involves a risk of loss which may partly be due to exchange rate fluctuations.
Conclusion – make the most of high yield through the golden age
We believe that fixed income is at the start of a golden age. As a result, we also believe that high yield may be the risk asset of choice for a number of investors during it.
In our view, given that we are at the top of the interest rate cycle with rate cuts on the horizon over the next few years, this may be ideal time to lock in compelling yields in high yield bond markets.
In our view investors should not be discouraged by current spread levels. For us, time in the market beats timing the market.
Most read
Fixed income

August 2022
Is it time to consider high yield?
Liability-driven investment, Fixed income

July 2022
Liability Driven Insights: A pit stop on your de-risking journey
Fixed income

April 2023
Catch a rising star: fallen angels may hold the key
Global macro

April 2022