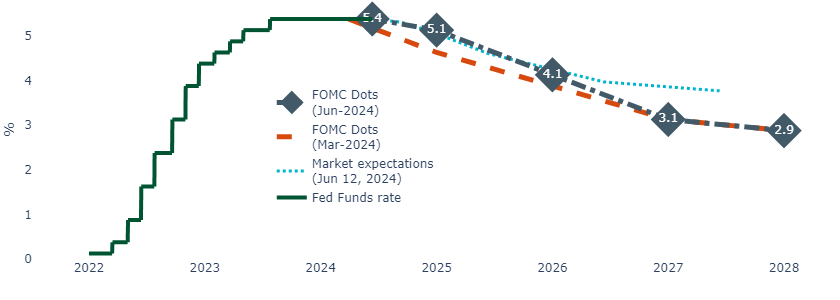
The Fed adjusted its “dot plot” projections to reflect just one cut in 2024, down from its previous projection of three, but it penciled a steeper course of four rate cuts to follow in 2025. We believe one or two cuts remains a sensible base case this year. Meanwhile, the latest CPI release offered encouraging signs that disinflationary trends remain in place.
FOMC projects one rate cut in 2024, but four cuts in 2025
As expected, the FOMC held the Fed Funds rates at 5.25% to 5.5% and left monetary policy unchanged.
The committee made only one modest change to its official statement, changing a reference from a “lack of progress” on inflation to “modest progress”. Elsewhere, the Fed left its economic projections largely unchanged, save for very slight increases in its unemployment, PCE and core PCE forecasts for 2025.
It adjusted its “dot plot” to reflect a median expectation of one rate cut in 2024, down from its last projection of three. Notably a larger number of committee members voted for two cuts rather than one, and Chair Powell indicated either scenario remains “plausible”. The committee also notably projected a steeper course of four rate cuts in 2025, up from three. This moves the “dots” in line with the latest market expectations for the next two years (Figure 1).
Figure 1: The FOMC projects one cut by the end of the year, down from three1

CPI eases pressure on the Fed
Ahead of the FOMC meeting, the CPI report showed some positive momentum after a string of disappointing prints earlier in the year. Chair Powell noted it was a “better report than most anyone expected”.
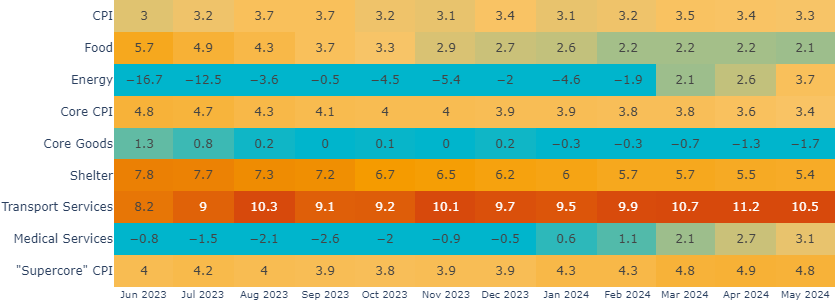
Headline prices were flat in May, down from 0.3% in April. This brought the headline inflation rate from 3.4% to 3.3%. The slowdown in the headline index was driven by 2% drop in energy prices, while food prices were up modestly by 0.1%.
Excluding food and energy, core prices rose 0.2% in May, the slowest monthly pace since August 2021, and lowered the annual rate from 3.6% to 3.4%.
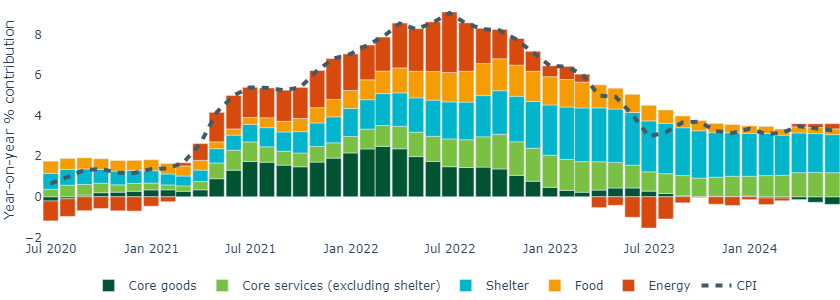
From a category perspective, core goods moved deeper into negative territory year-on-year, falling from -1.3% to -1.7%, the lowest since 2004. New vehicle prices were down 0.5% for the second consecutive month. Used car prices rose 0.6% but are more than 9% below last year’s levels.
Figure 2: Core goods categories reached their lowest year-on-year level since 20042

There were also positive takeaways in the “sticky” core services sectors (which we are watching closely for clues on long-term trends).
Encouragingly, the “supercore” services sector (which excludes shelter) eased from 4.9% to 4.8% year-on-year after two strong months. Transportation services fell, with motor insurance prices notably falling -0.1% in May after two hot prints.
Shelter continued to slow on a year-on-year basis, edging down from 5.5% to 5.4%, though progress there remains glacial. We do expect this measure to continue slowing gradually over the next few months, given a continued slowing in market rents (which tend to directionally lead the CPI rental category by ~12 months).
Figure 3: Core services see some mild relief from shelter and “supercore” inflation2

We believe September remains in play for a rate cut
We believe a rate cut in September remains a sensible base case, with the Fed then leaving a second cut as possibility by the end of the year. After a tough start to the year, another helpful CPI print offered some relief to the Fed. Although it will need to see more prints like this over the coming months before becoming comfortable about cutting rates, we believe disinflationary trends remain in place.
In our view, with rate cuts still in sight, allocating to fixed income ahead of the rate cutting cycle remains an attractive proposition.
 United States


