A slower than expected decline in inflation has pushed out rate cuts
Continued economic strength and some signs of stickiness in inflation have seen some reassessment of how quickly cuts will come. The speed with which market expectations had moved to price-in rate cuts always looked at odds with the likely reaction function of central banks and, arguably, rate expectations today are much closer to a path that resonates with central bankers and the bulk of the forecasting community.
The inflation data remains key – if Q1 2024 sees a continuation in the trend lower for core inflation then there is a realistic claim that they have inflation under control. Wages remain central to this. The story of the post pandemic inflation spike has many chapters. There was an energy and food component, exacerbated by Russia’s invasion of Ukraine. Demand for goods jumped more quickly than supply, constrained by various bottlenecks, but most of these forces are, from an inflation perspective, on the wane. Services inflation is stickier. Eurozone services prices rose 3.9% year on year in February, marginally down from the 4% seen in the previous three months.
Complicating central banks decision making is the resilience of labour markets in the face of policy tightening. Much has been written about the robust state of the US labour market, but as Figure 1 shows, even in the eurozone where activity has been much more subdued, labour market conditions remain tight.
Figure 1: Inflation in the US and euro area has fallen sharply without an increase in unemployment

Source: Insight and Bloomberg. Data as at 29 February 2024.
Growth appears to be stabilising, but inflation will drive central bank action
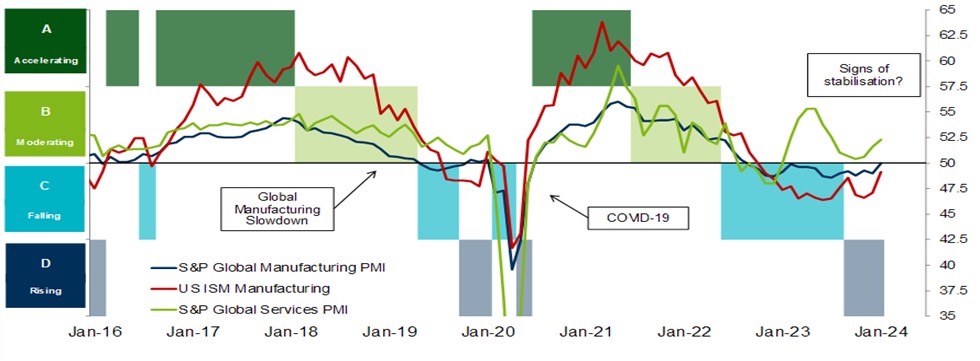
Regular readers may be aware of our regime-based asset allocation framework, which helps us assess likely asset class behaviours in different growth, inflation, and real rate environments. To summarise our investment thesis since Q4 2023 – growth dynamics appear to be stabilising (see Figure 2); inflation, whilst above central bank targets, is on its way down.
Figure 2: Global growth appears to be stabilising

Source: Insight. For illustrative purposes only.
In our view, it is inflation, and specifically a moderation in wages, that will drive central bank policy.
Wage growth accounts for around 45% of the prices used to calculate inflation in the eurozone so it is key. A lot of wage negotiations take place in the first quarter, and it will not be until the second quarter that policy makers will be able to assess progress. Earlier in the year, demands by the German construction union will have caused concern, while a range of strikes across the transport sector are another indication of unions flexing their muscles against a backdrop where staff shortages are evident.
The US is in a different position. But even here, expectations are already pointing to softer growth ahead. Admittedly, this has been said many times before, but data such as hiring intentions in the National Federation of Independent Business (NFIB) survey and rising layoff announcements in the Challenger survey suggest softer future labour market data.
For now, our assumption is declining inflationary forces will open a window for easier monetary policy later in the year. Indeed, with the current moribund state of activity there seems little risk of a reacceleration in inflation.
Although valuations and positioning extremes can complicate the picture, purely from a cyclical standpoint, an environment of stabilising or improving growth, combined with declining inflation has historically been a reasonable investment backdrop from a cyclical standpoint.
A narrow rally, but fundamentally driven
Given this backdrop it is not surprising that equity markets have been performing well, even against a more challenging fixed income backdrop. There has, however, been plenty of commentary pointing to the narrow leadership of the rally, with excitement around artificial intelligence driving tech mega caps upwards, led by the Magnificent 7 (Alphabet, Apple, Amazon, Meta, Microsoft, Nvidia and Tesla).
Although it is certainly true that most stocks are lagging their index when the mega caps are leading, in February the equally weighted S&P 500 Index still posted a +4.2% return whilst the Russell 2000 Index rose over 5.5%. There is also an argument that the leadership of the Magnificent 7 is based more firmly in fundamentals than some would suggest.
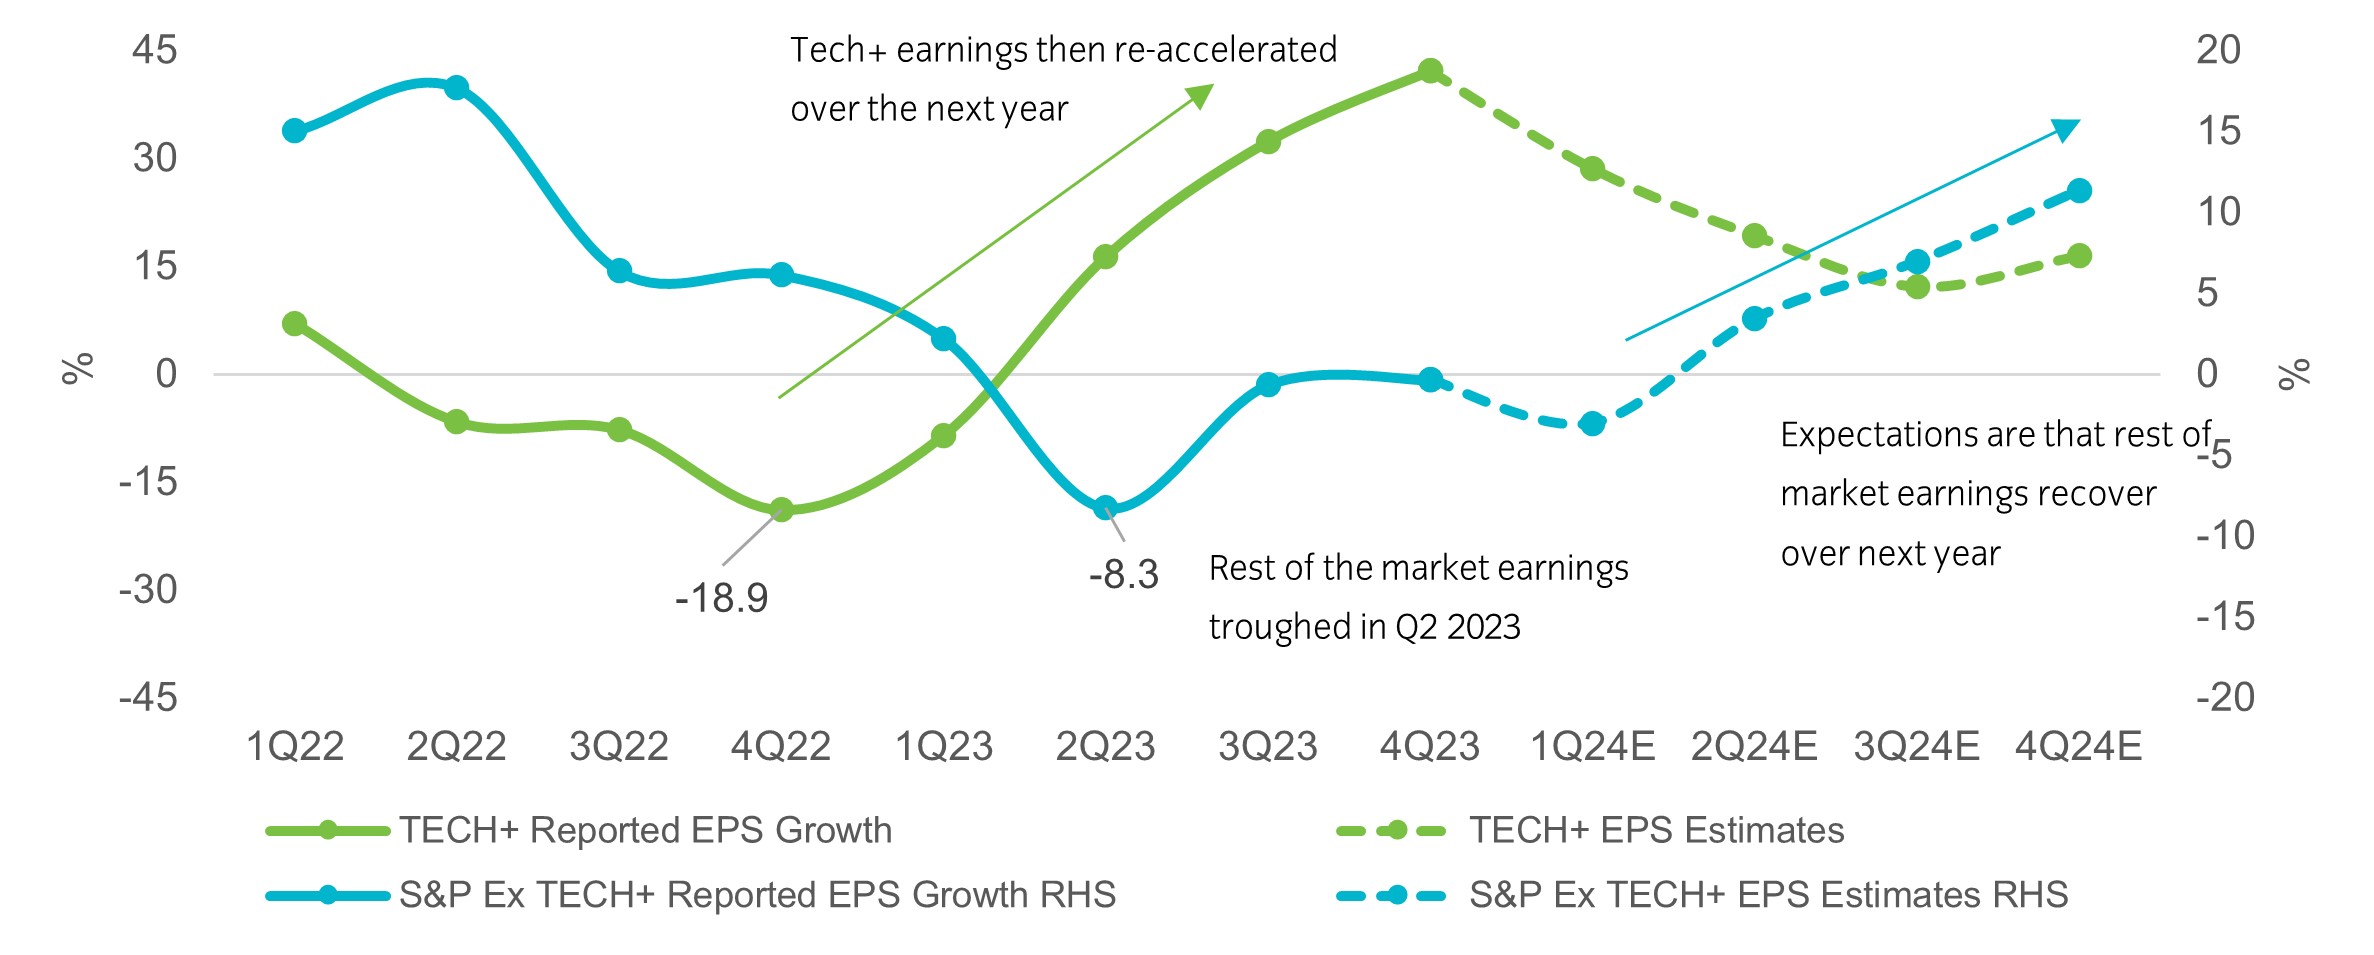
In Figure 3, we look at the path of earnings per share (EPS) growth for US companies in the post pandemic world across two key cohorts. These is a ‘TECH+’ basket (which includes the full S&P 500 Index technology sector, plus the large cap tech-centric firms not classified in this sector such as Alphabet and Amazon) versus all other index members (i.e. the S&P 500 Index excluding TECH+).
Figure 3: Tech and megacap earnings have recovered sharply…..will the rest of the index follow?

Source: UBS, Insight.
For the TECH+ firms, earnings growth troughed at the end of Q4 2022, and has reaccelerated in the 12 months since. Indeed, earnings growth for these firms drove virtually all of the headline EPS gains in the most recent reporting season. However, the S&P 500 Index ex TECH+ firms did not see earnings trough until two quarters later, and we are only now seeing tentative signs that they will return to positive EPS growth this year. It is interesting to note, the path of earnings for these firms, has much more closely mirrored the turning points in our growth regime framework. This makes sense given the intrinsic link between the growth cycle and profit cycle and highlights the potential for a more broad-based equity participation if a further pickup in growth were to occur.
Earnings growth ultimately drives stock market returns over the long term. The ascent of the Magnificent-7 over the last decade has largely reflected their exceptional earnings growth. Whether that is sustainable is an open question, however we are equally interested in whether the earnings cycle of the forgotten 493 might be turning upwards. The mega caps will continue to dominate index performance, almost by definition, but as we showed earlier, looking at the number of index constituents with performance above their moving averages reveals dynamics that look a little healthier than some of the commentary on narrow leadership suggests.
For more thoughts from our multi-asset team click here.
 United Kingdom


