Chart of the week
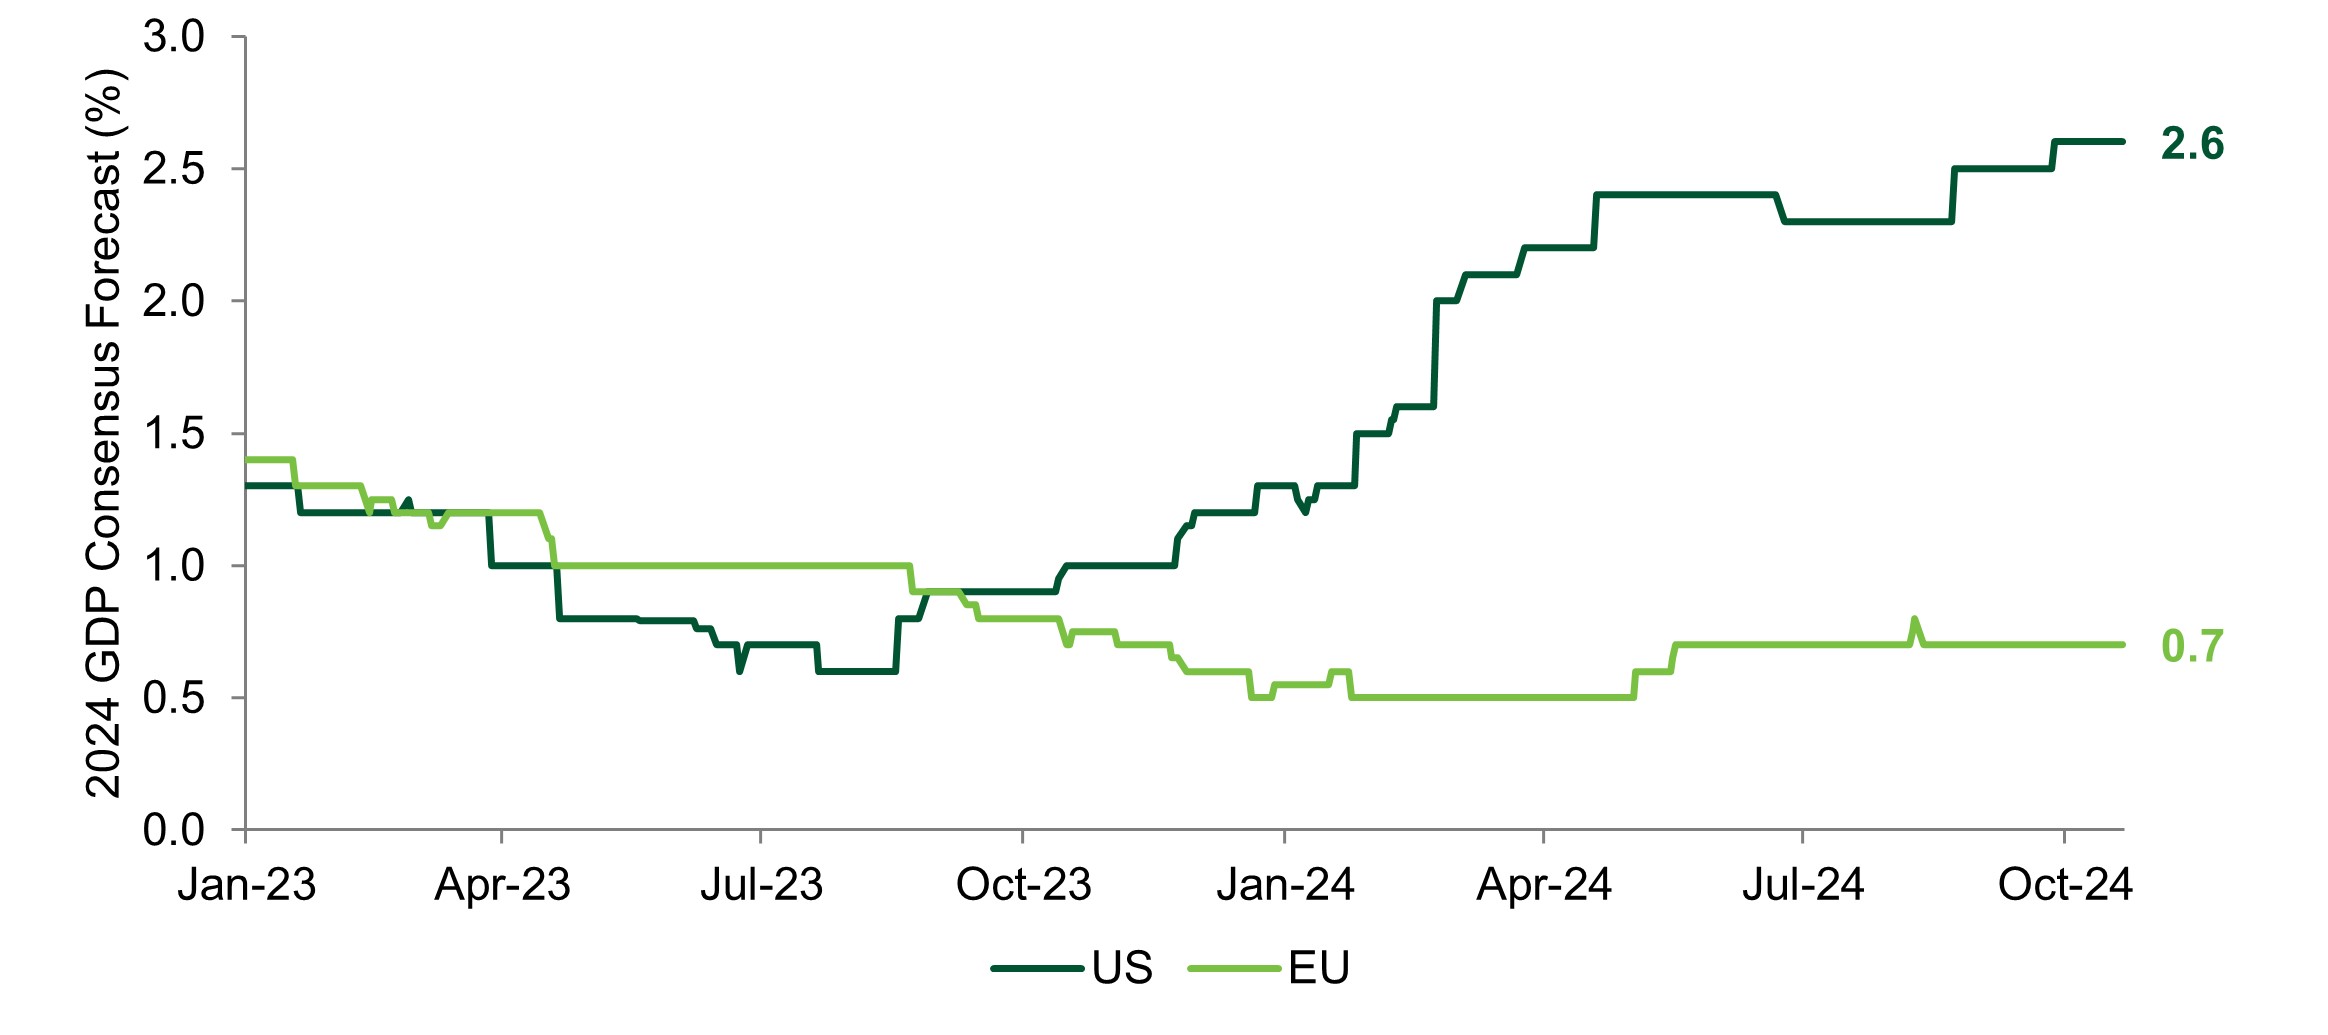
Divergent GDP growth in US and Europe
Source: Insight Investment and Bloomberg as at 25 October 2024.
- The economic picture in the US is one of far more resilience relative to European peers. While the consensus forecast for 2024 GDP growth in Europe has flatlined at 0.7%, estimates for the US have gradually been revised up and 2.6% growth is now expected.
- The better US economic data over the past month has driven a rise in US bond yields relative to German bonds. The US 10yr bond currently yields 4.18% whereas the German 10yr bond yields 2.26%. The gap broadly matches the growth differential that is expected over the next couple of years between the two countries.
Significant market moves this week
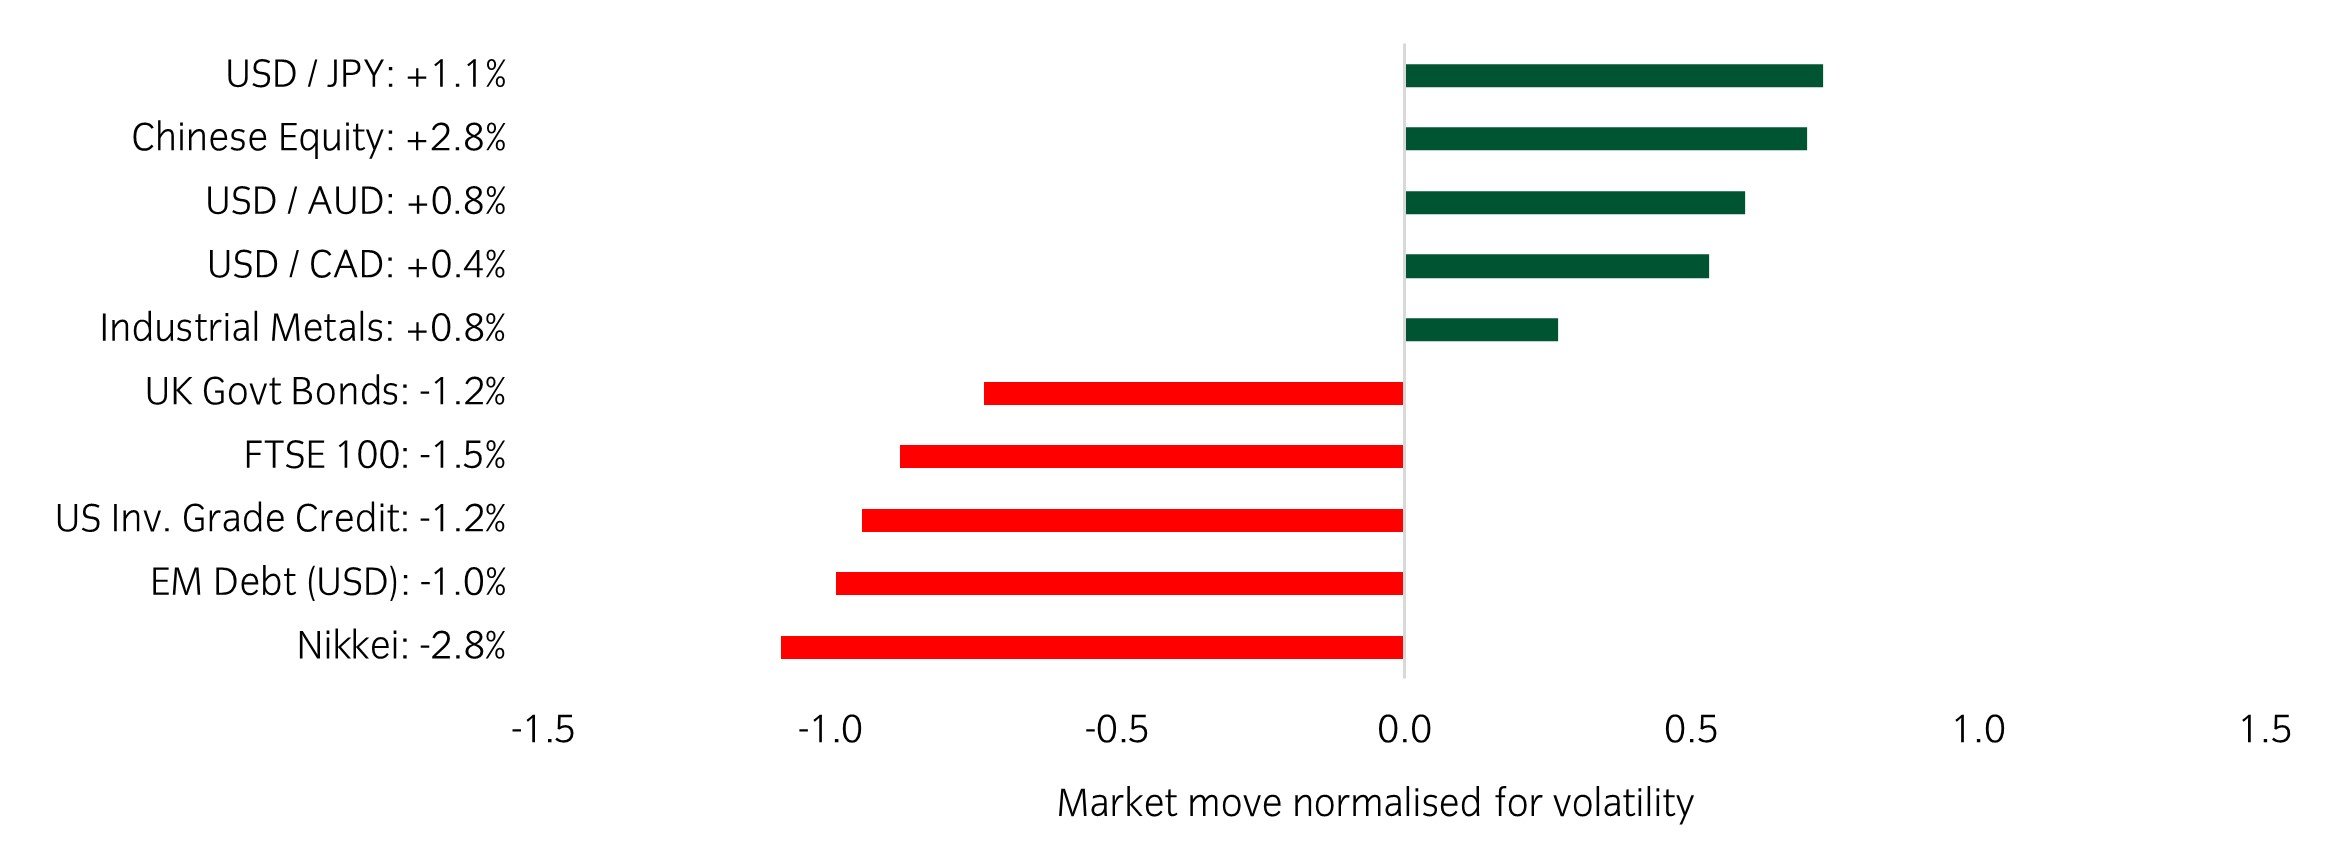
Source: Bloomberg and Insight as at 25 October 2024. The price movement of each asset is shown next to its name. The data used by the bar chart divides the price movement by the annualised historical volatility of each asset.
Winners & losers: The US dollar continued its strong run with USDJPY surpassing ¥152 for the first time since July. The Nikkei 225 Index underperformed following uncertainty over a snap election due to take place on Sunday.
Over the past week, several things caught our eye:
- Tesla rose 22% on Thursday, its largest move since 2013 and a move greater than the combined market cap of GM, Stellantis and Ford. This was spurred by an earnings report that reflected strong earnings and revenue growth alongside a large beat in gross margin (18.5% vs 15.1% expected).
- Flash PMIs for October were a mixed bag with disappointing numbers from Japan and France while Germany showed small signs of recovery and the US remained resilient.
- Trading volumes remain light in equity markets as investors prepare for a bumper two weeks which include megacap earnings, key macro data and the US election.
Winners & losers: The US dollar was stronger on the week while energy markets weakened as fears of geopolitical escalation dissipated.
Asset allocation observation
A busy period ahead

Source: Insight and Bloomberg as at 25 October 2024.
- The US election is now front and centre of market thinking, but the days around it contain a plethora of important data.
- The last three days of October will see the majority of the Magnificent 7 report Q3 earnings before Friday’s all important jobs reports and ISM manufacturing PMI.
- Arguably most interesting of all is the FOMC’s meeting occuring two days after the election.
Chart of the week
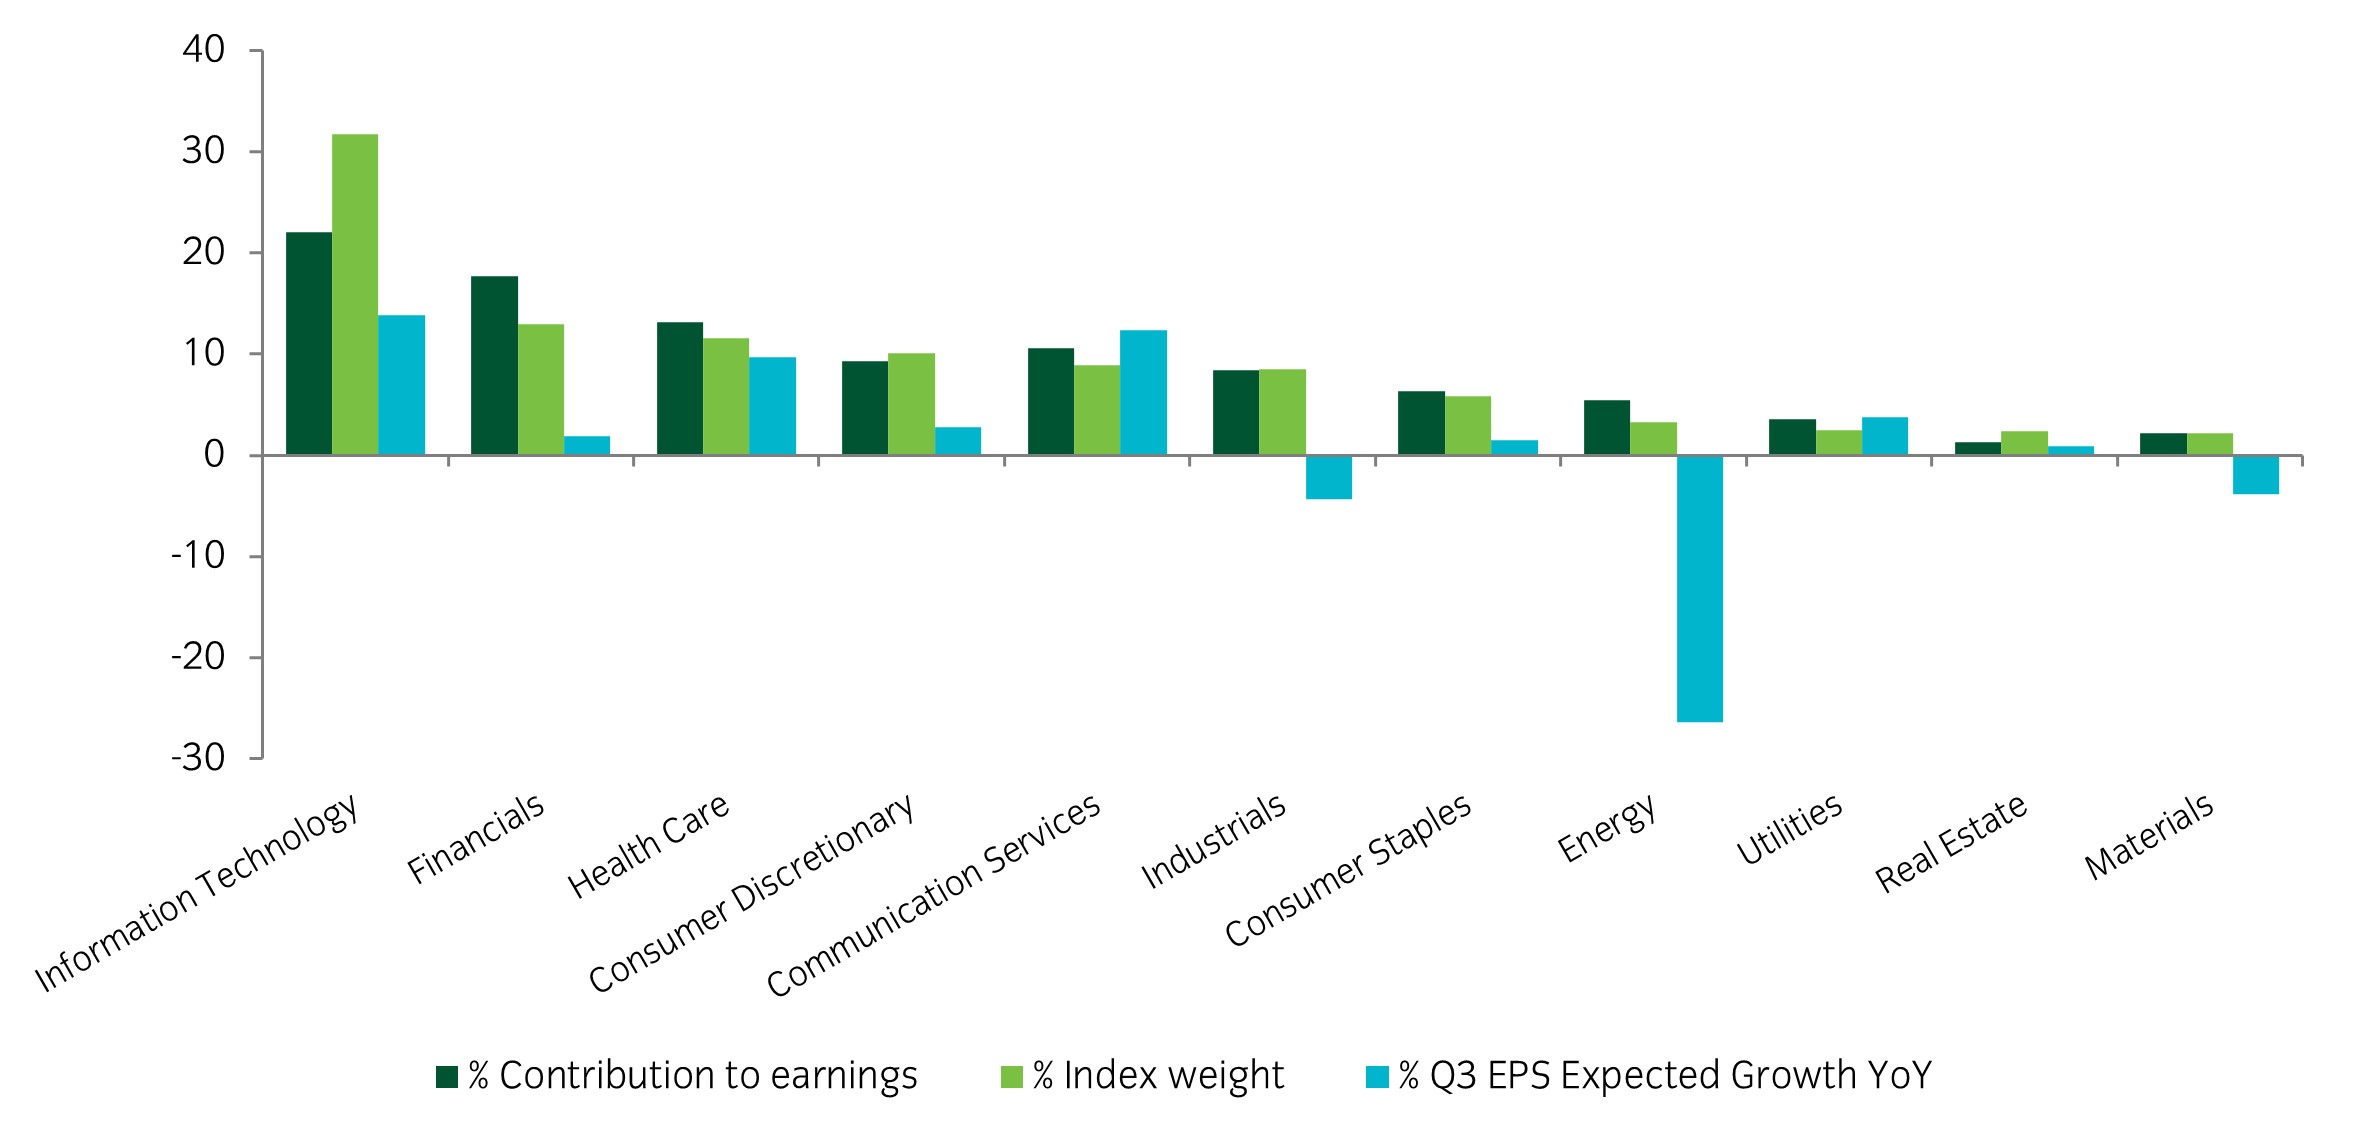
US earnings kick off with strong results from financials
Source: Insight Investment and Bloomberg as at 18 October 2024.
- Q3 earnings season kicked into gear over the past week. All of the major US banks have now reported, with strong results across the board and both net interest margins and the capital markets divisions surpassing estimates. Our chart of the week highlights how important earnings from financials are for the S&P 500 index, contributing the second-highest proportion earnings of any sector. The chart also highlights that this contrasts significantly with the banks' market cap.
- The technology sector stands out with the largest index weight, highest contribution of operating earnings, and highest expected year-over-year EPS growth.
- In contrast, the energy sector shows the lowest negative EPS growth, although the ratio of its contribution to operating earnings divided by its contribution to overall market cap is one of the highest among the group. This is notable given that energy drove the bulk of negative revisions coming into the quarter. However, it is less concerning than had if it been from one of the larger sectors.
Market watch
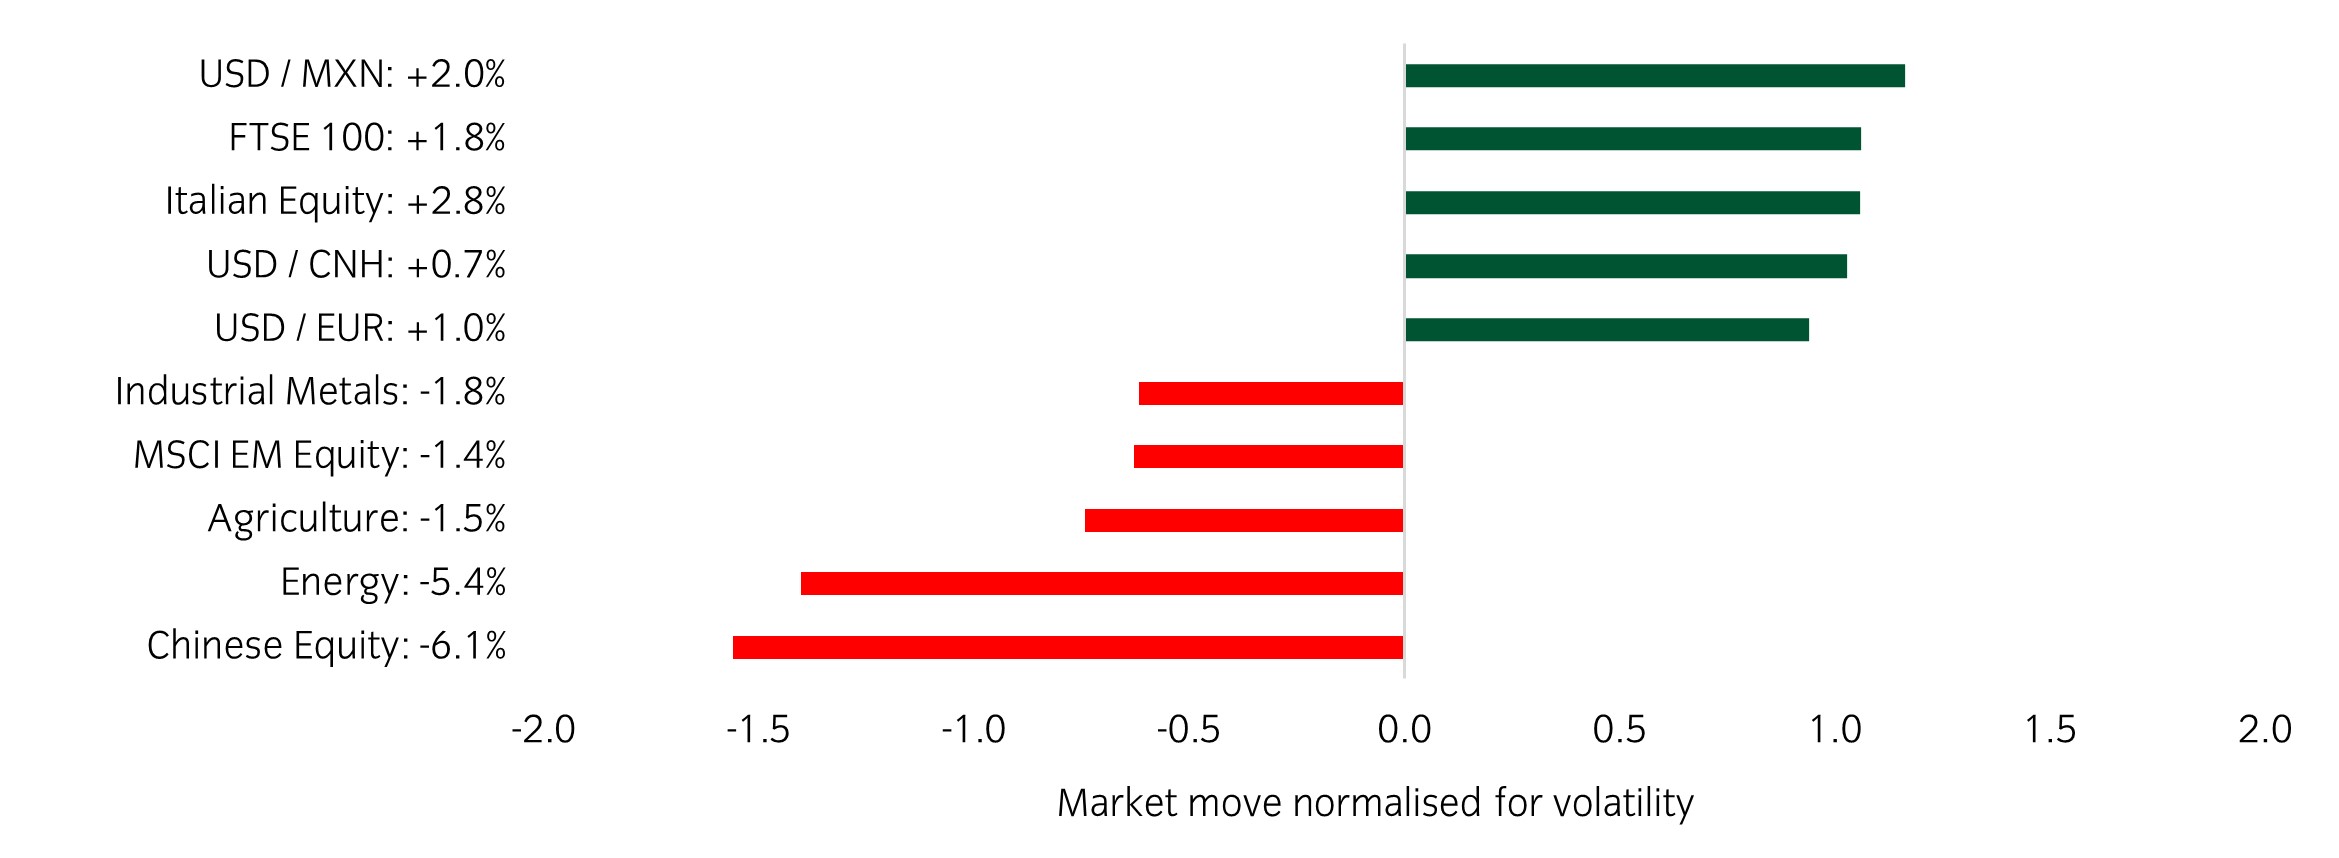
Source: Bloomberg and Insight as at 18 October 2024. The price movement of each asset is shown next to its name. The data used by the bar chart divides the price movement by the annualised historical volatility of each asset.
Over the past week, several things caught our eye:
- US banks kicked off earnings season with a strong set of results. Earnings beats from JP Morgan, Wells Fargo, BAML, Goldman Sachs and Citigroup have lifted the KBW Bank Index by 6% since last Friday.
- The European Central Bank cut rates by 25 basis points to 3.25%. This marks their first consecutive cuts of the cycle, having lowered the rate at their previous meeting in September. The basis for this was headline CPI falling below the bank’s 2% target and a backdrop of slowing growth.
- Chinese authorities continued to drip-feed stimulus announcements to the market. Most were seen as in line or slightly disappointing, leading to the underperformance of Chinese equities.
Winners & losers: The US dollar was stronger on the week while energy markets weakened as fears of geopolitical escalation dissipated.
Asset allocation observation
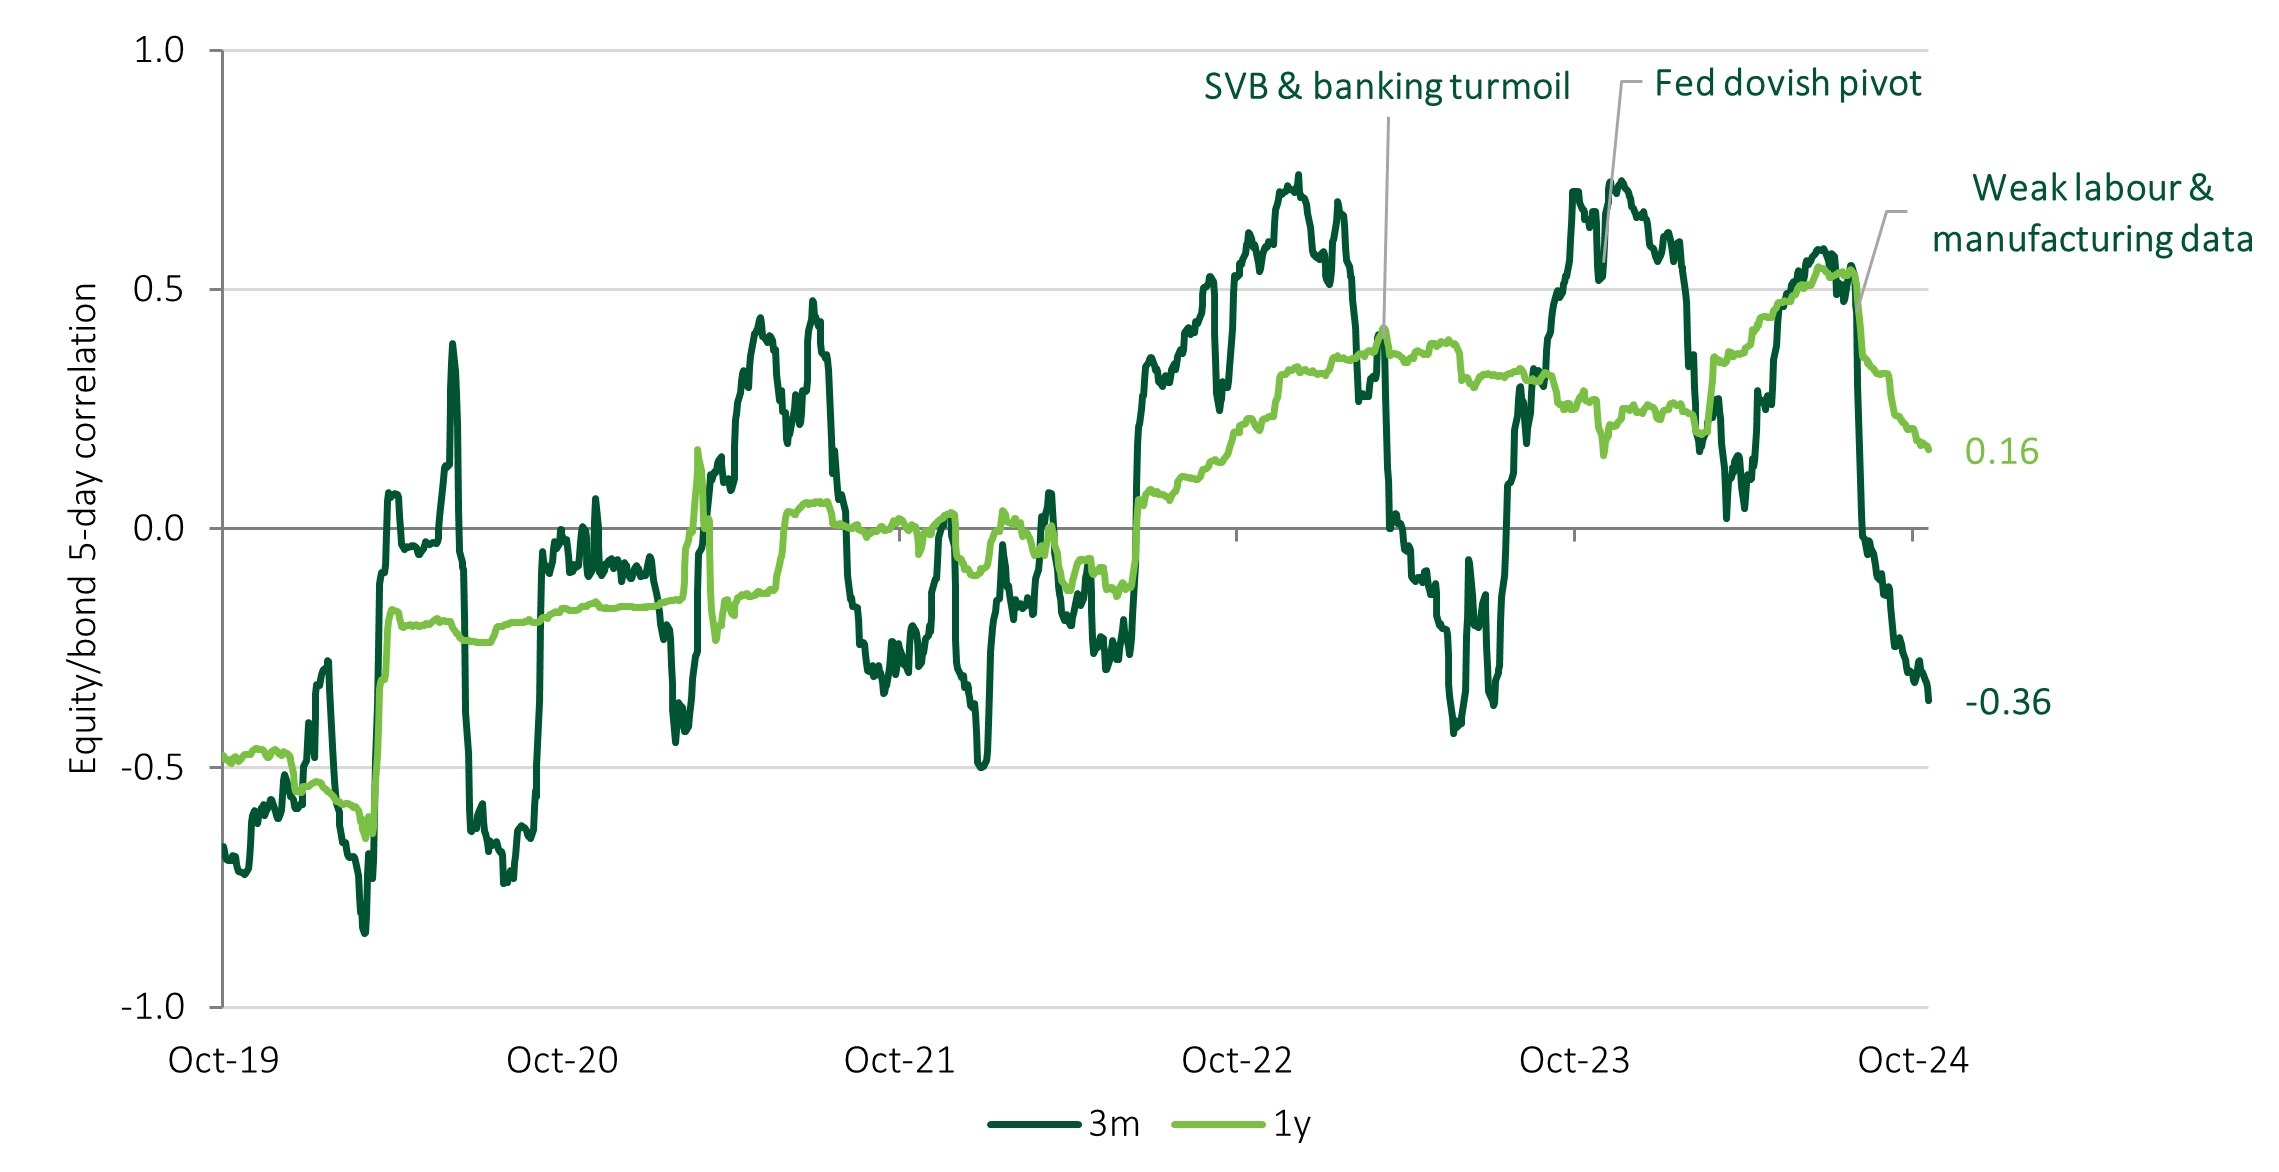
The equity/bond correlation
Source: Insight and Bloomberg as at 18 October 2024.
- The correlation between equities and bonds has turned more useful as growth has overtaken inflation as the most important macroeconomic driver. While correlations remain slightly positive on a 1-year lookback (0.16), a shorter 3-month window shows a -0.36 correlation. Previous turning points have coincided with the narrative shifting from inflation to growth, notably following the collapse of Silicon Valley Bank and subsequent turmoil in financials, and the Federal Reserve pivoting from a hiking to cutting cycle back in November 2023.
- Having been underweight for most of the year we have been increasing duration in recent months. This is a nod towards its benefit as a diversifier in the portfolio, as well as the historically positive performance of government bonds during cutting cycles.
Chart of the week
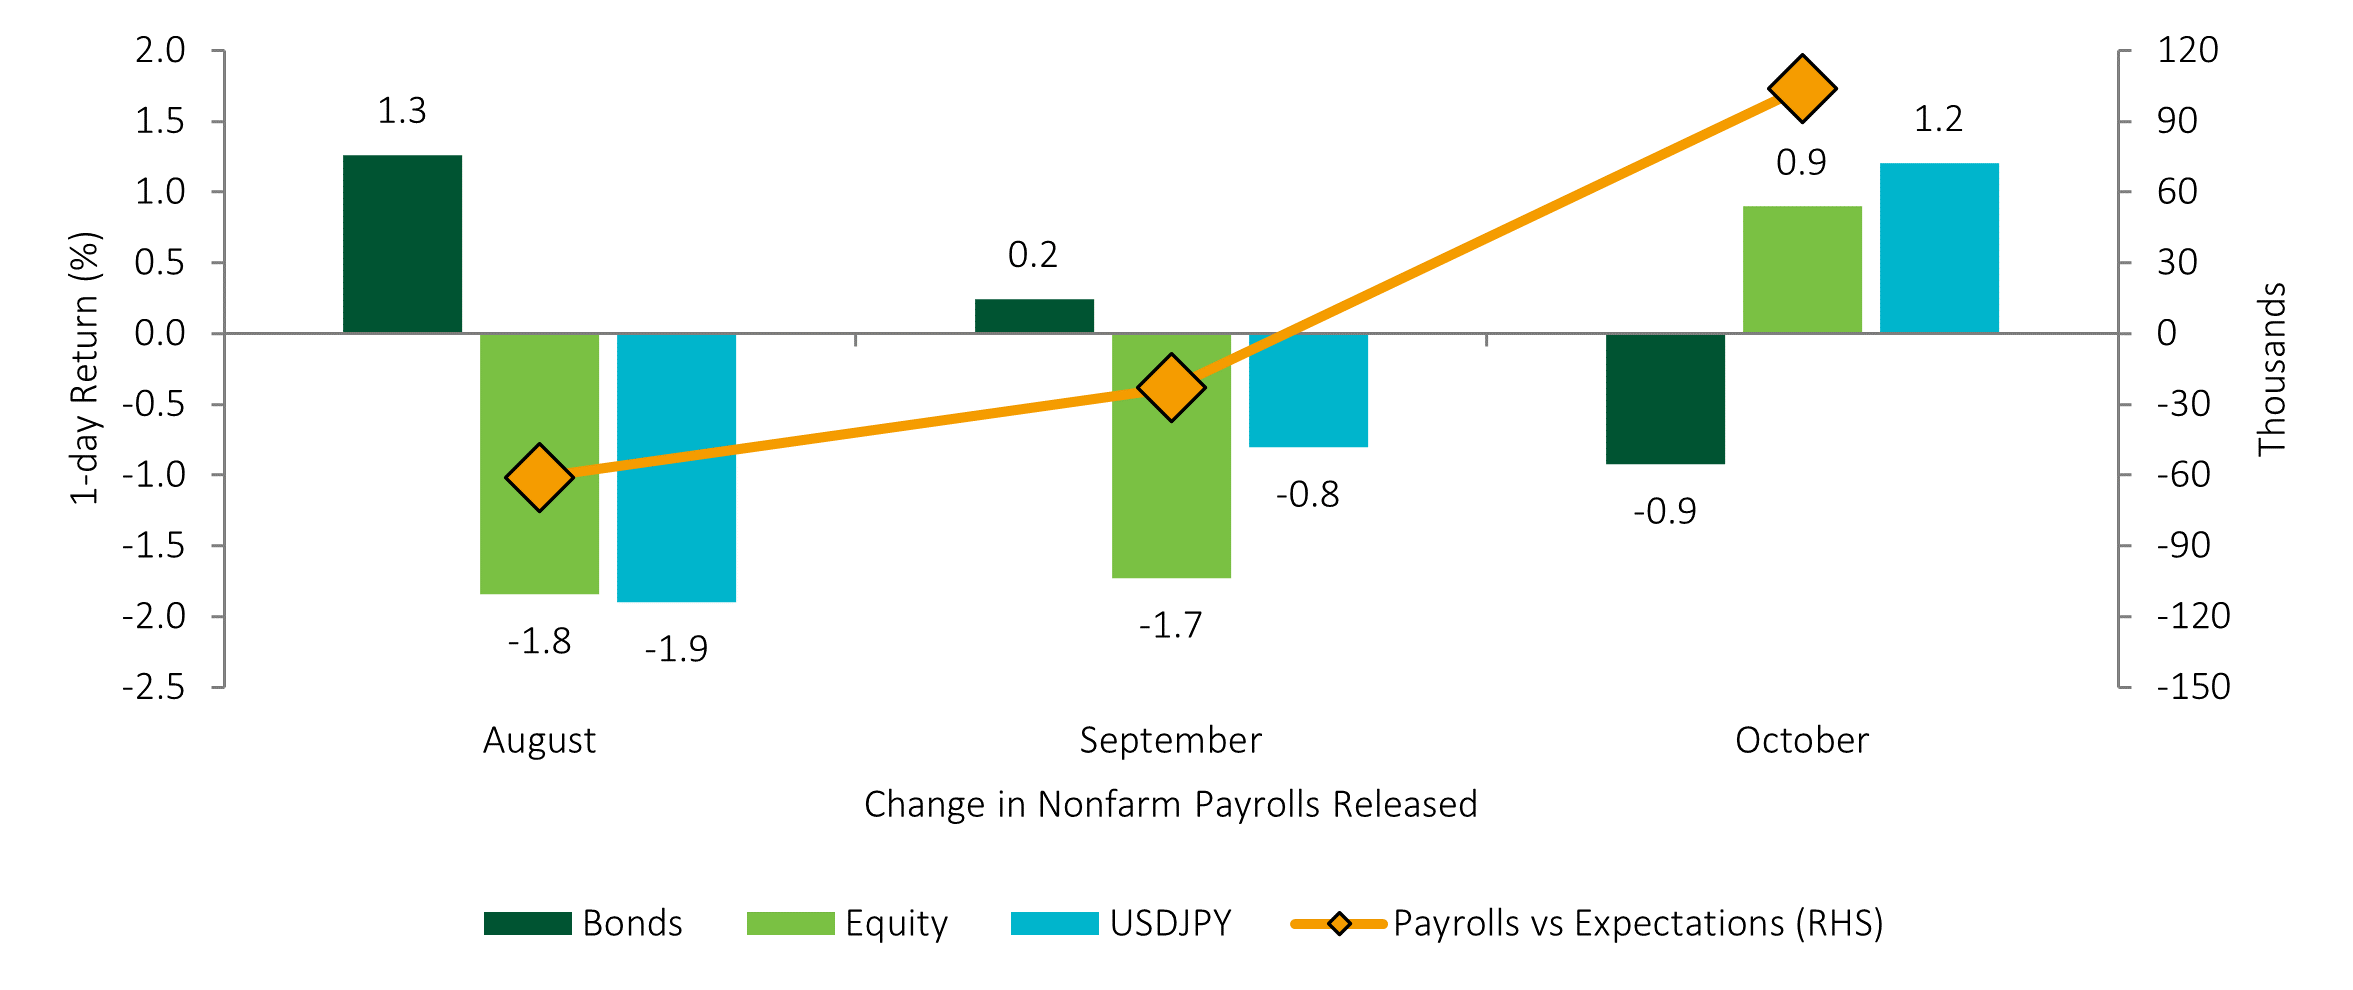
Stronger US employment figures soothe growth concerns
Source: Insight Investment and Bloomberg as at 09 October 2024.
- Markets are now priced for a standard 25bps cut at the next FOMC meeting in response to the latest nonfarm payrolls data, which was much stronger than expected. Recent months have seen US employment data become the most important economic data point, with a large influence on Fed policy and the market’s assessment of the economic outlook. Indeed, a series of underwhelming jobs' reports paved the way for expectations of an aggressive easing cycle, with the Fed electing for a jumbo 50bp cut in September.
- Asset class movements on the day of the latest release were significant. Equities rallied as the growth outlook improved whilst bonds and the US dollar reacted to shift towards a less aggressive Fed easing profile. This has increased confidence in our base case ‘soft landing’ scenario.
Market watch
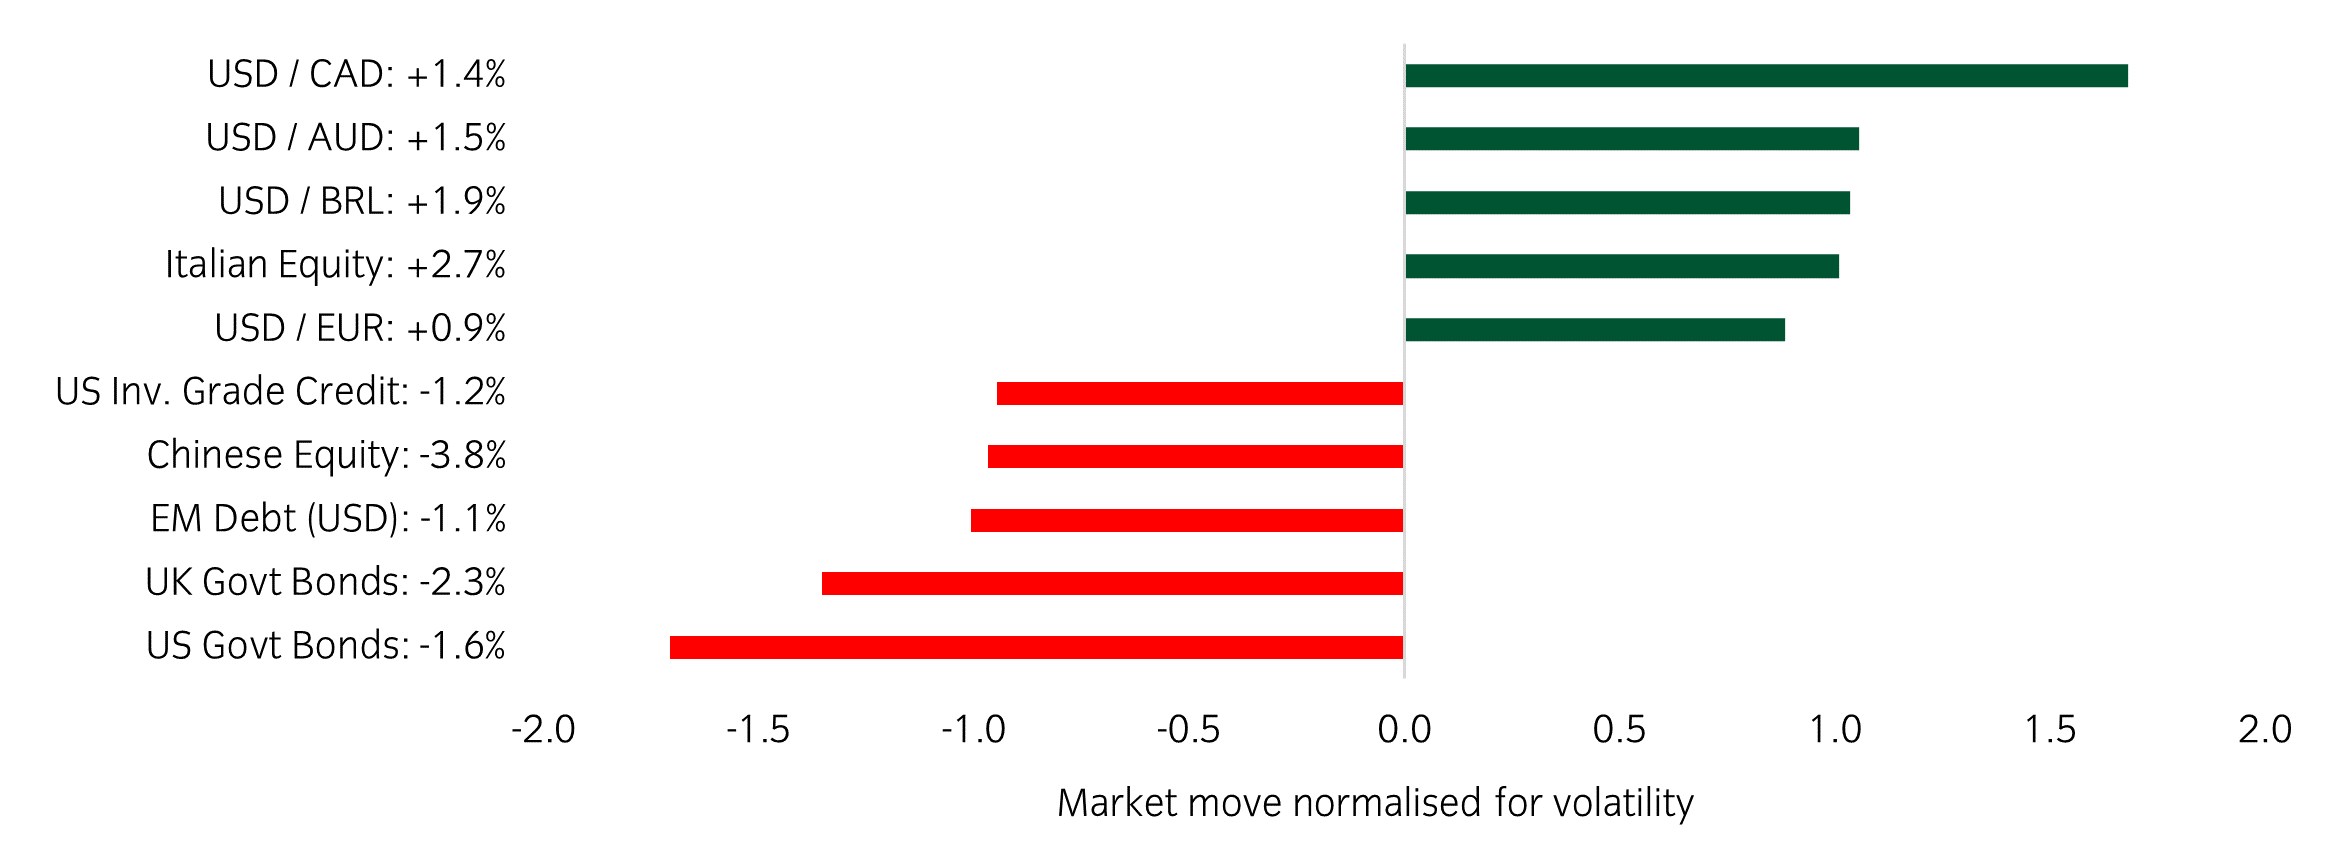
Source: Bloomberg and Insight as at 11 October 2024.The price movement of each asset is shown next to its name. The data used by the bar chart divides the price movement by the annualised historical volatility of each asset.
Over the past week, several things caught our eye:
- Following last week’s blowout US jobs report yields backed up sharply, with the US 10-year yield rising back above 4% for the first time since early August.
- US CPI came in slightly hotter than expected, with the headline number rising to 2.4% year-on-year while the core number rose to 3.3% YoY (and +0.31% MoM). However, the market reaction was muted with the S&P ending the day only 20bps lower.
- Energy markets remained volatile this week with reactionary moves to geopolitical headlines from the Middle East. This is certainly one to watch, as the potential knock-on effect of a price spike would coincide with the end of helpful inflationary base effects.
Winners & losers: The US dollar was stronger on the week while UK and US government bonds underperformed.
Asset allocation observation
The US election remains a wild card
Source: Insight and Bloomberg as at 11 October 2024.
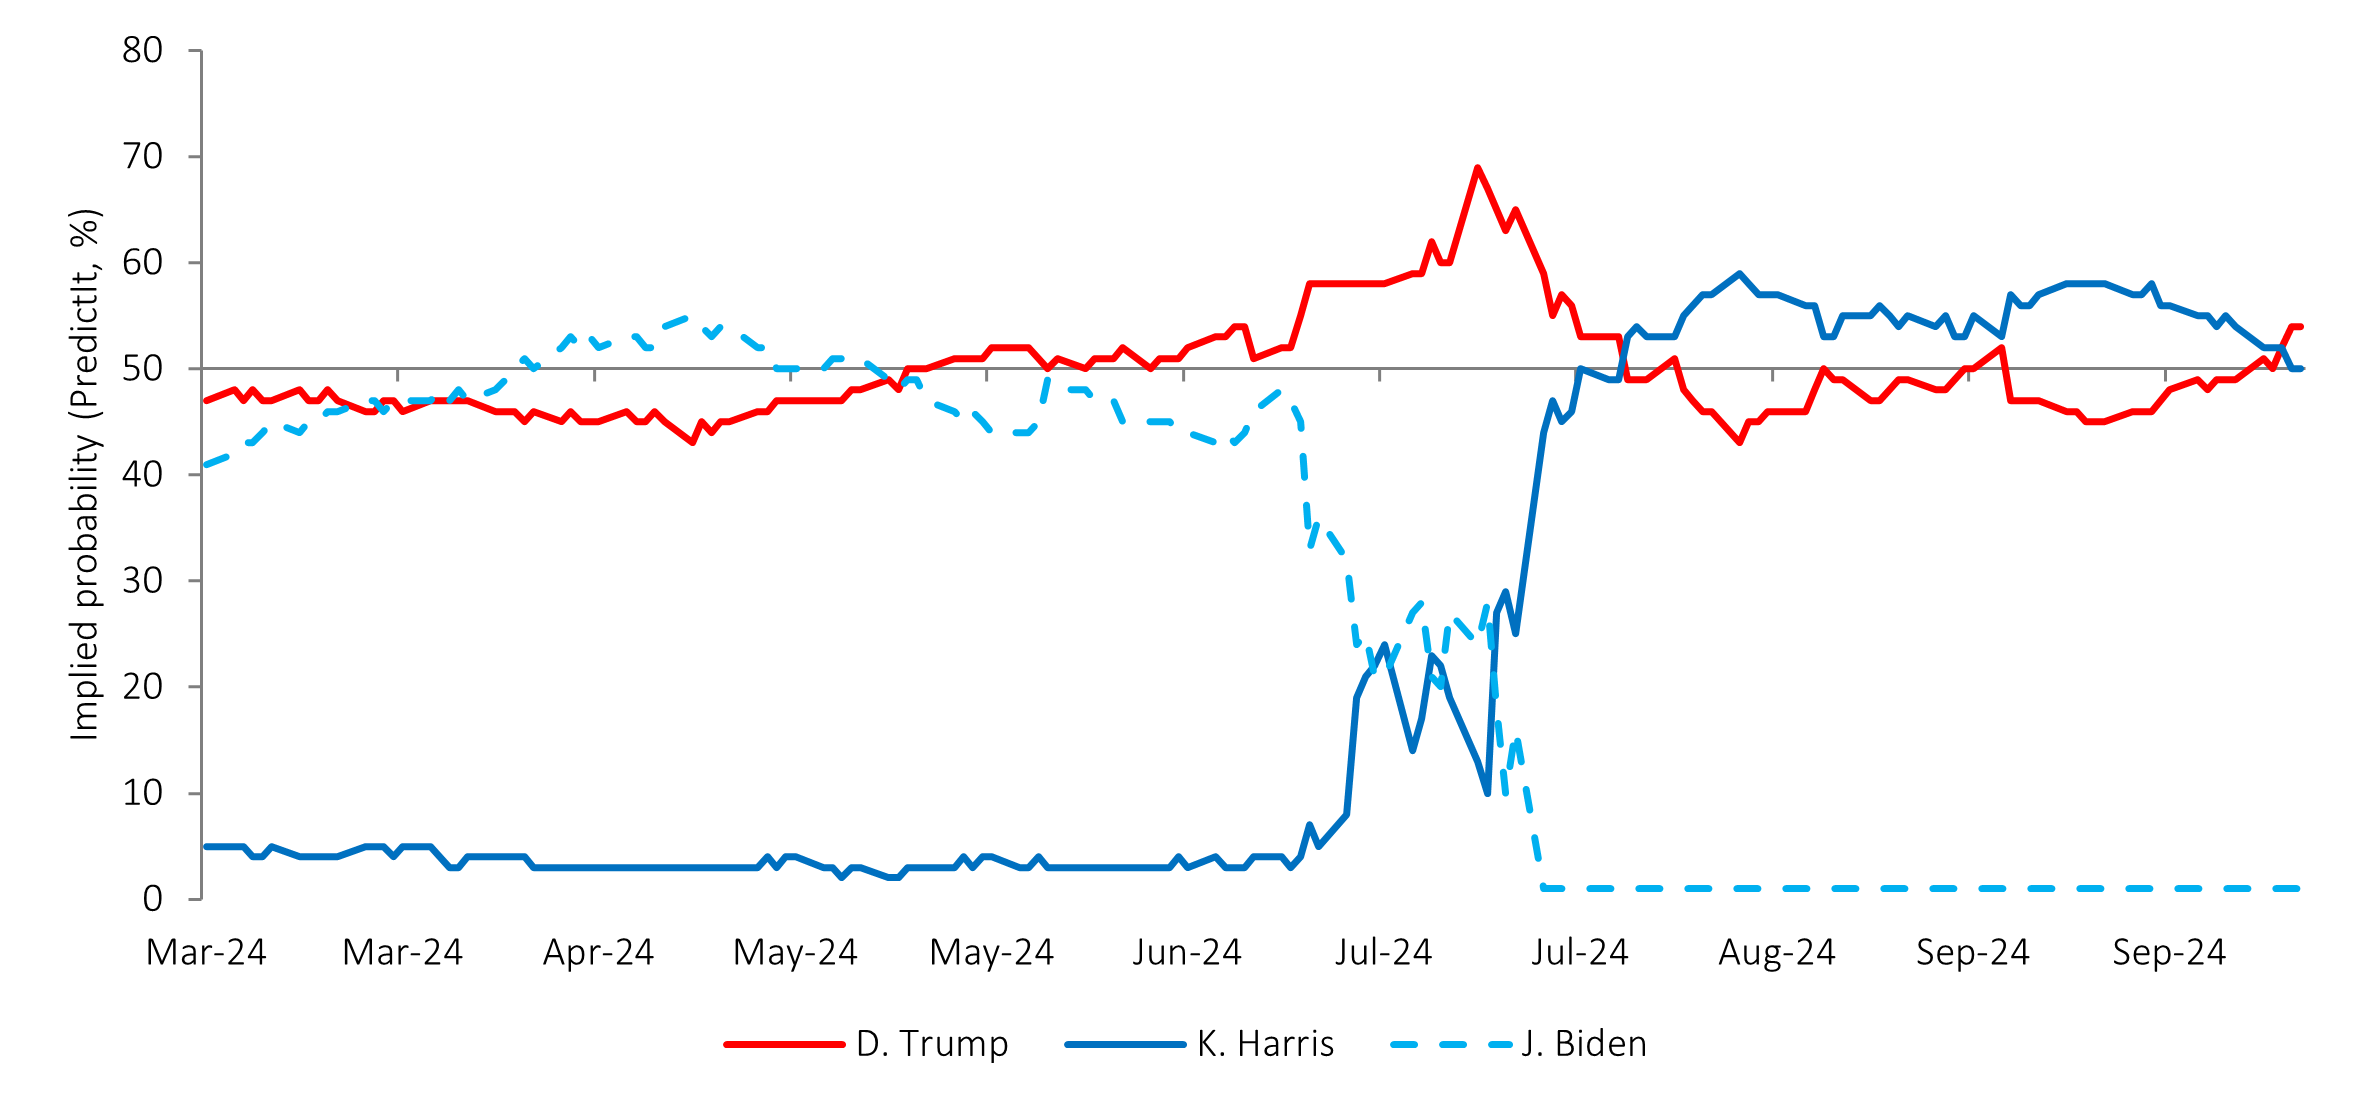
- With the US elections only a month away, polls indicate an exceptionally tight race. The result is likely to hinge on a handful of ‘swing states’, where the candidates appear closely tied. Current market thinking is that a Trump victory would benefit banks and domestic US stock markets at the expense of Europe and China, with his policies also likely more inflationary than those of Harris.
- Given the current coin flip nature of the result, we prefer to keep the portfolio near its long term average positioning, favouring the ability to take advantage of opportunities that will arise in the aftermath.
Chart of the week
Chinese equities bounce off lows
Source: Insight Investment and Bloomberg as at 04 October 2024.
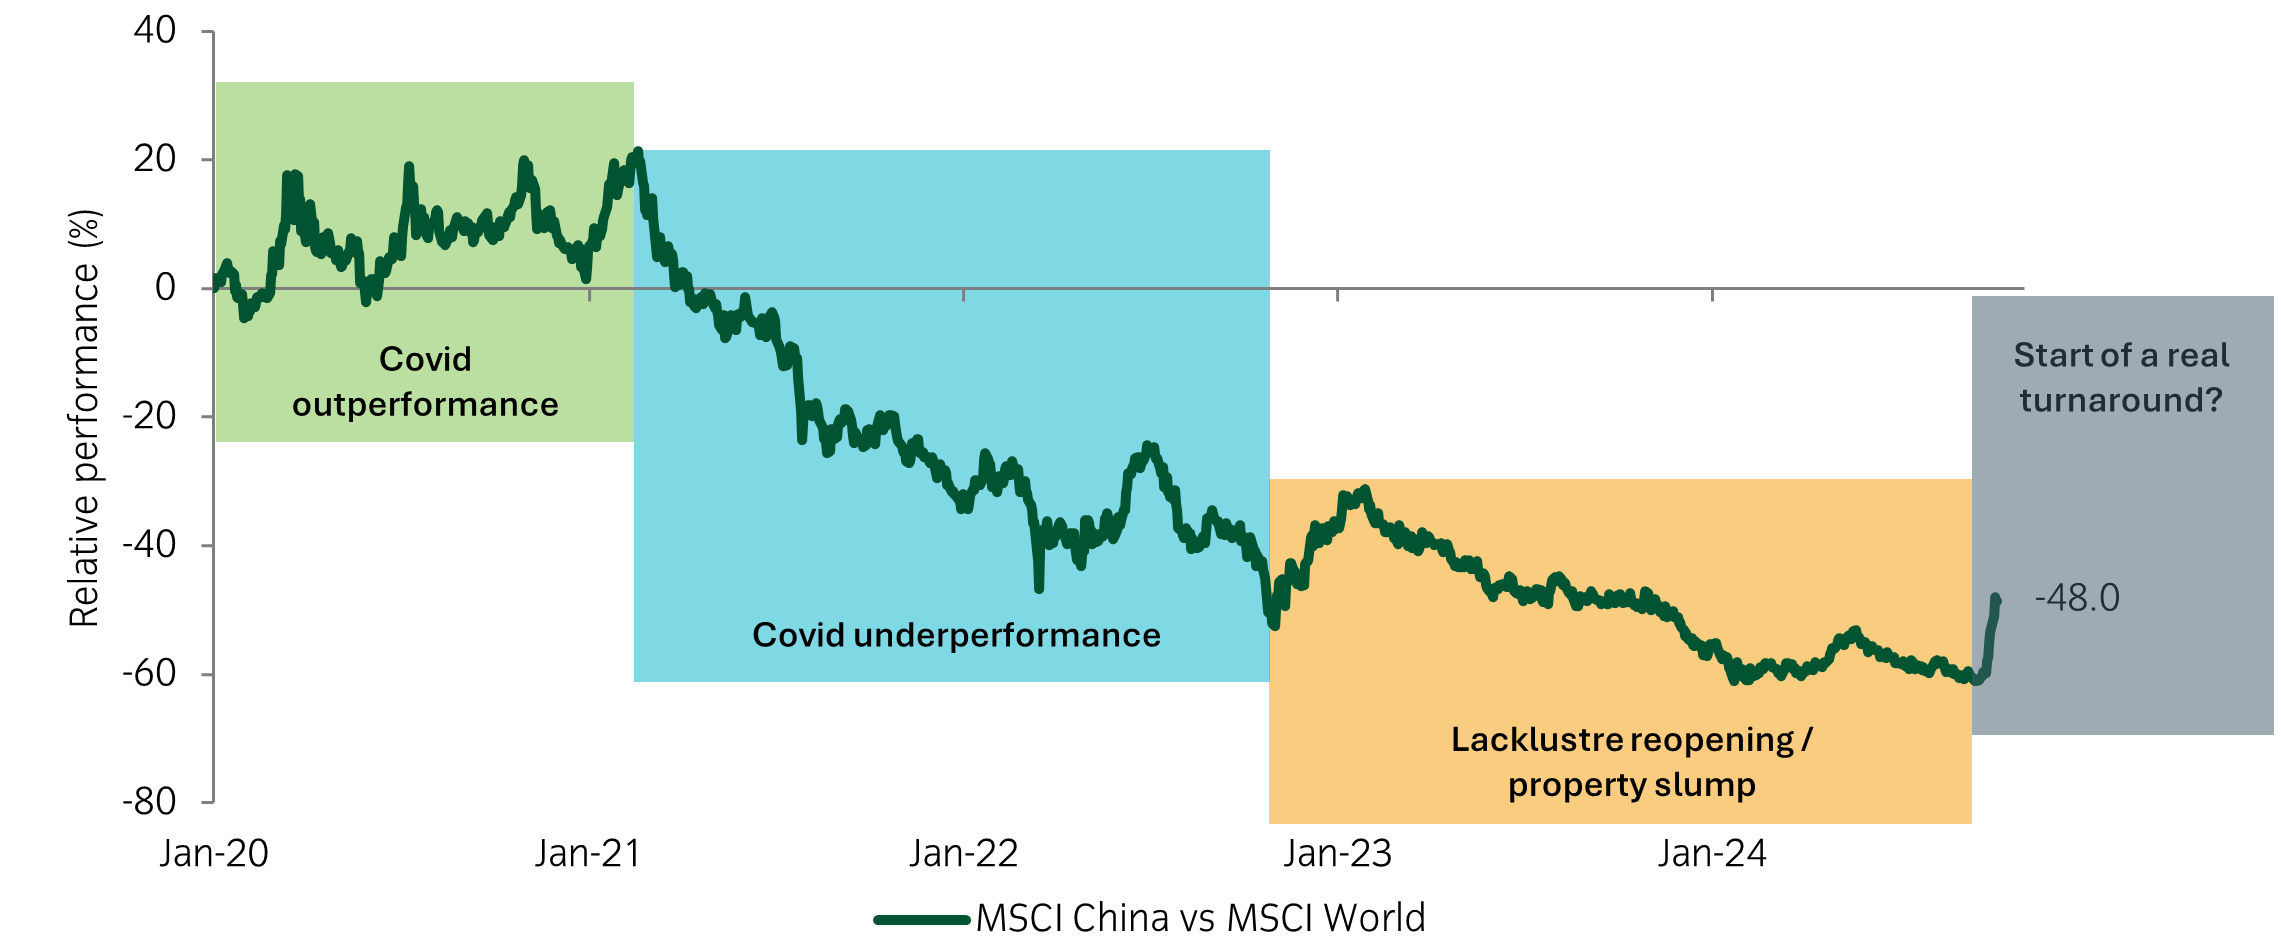
- Monetary and fiscal stimulus powered Chinese equities to their second-best month of returns in five years in September. The equity market had been shunned by investors since the global reopening from Covid, with underperformance compounded by a major property slump. Questions remain around the long-term growth outlook, but these new measures have certainly bolstered this previously stumbling economy.
- Within our portfolios, we have positioned for further volatility, benefitting from outsized moves in either direction.
Market watch
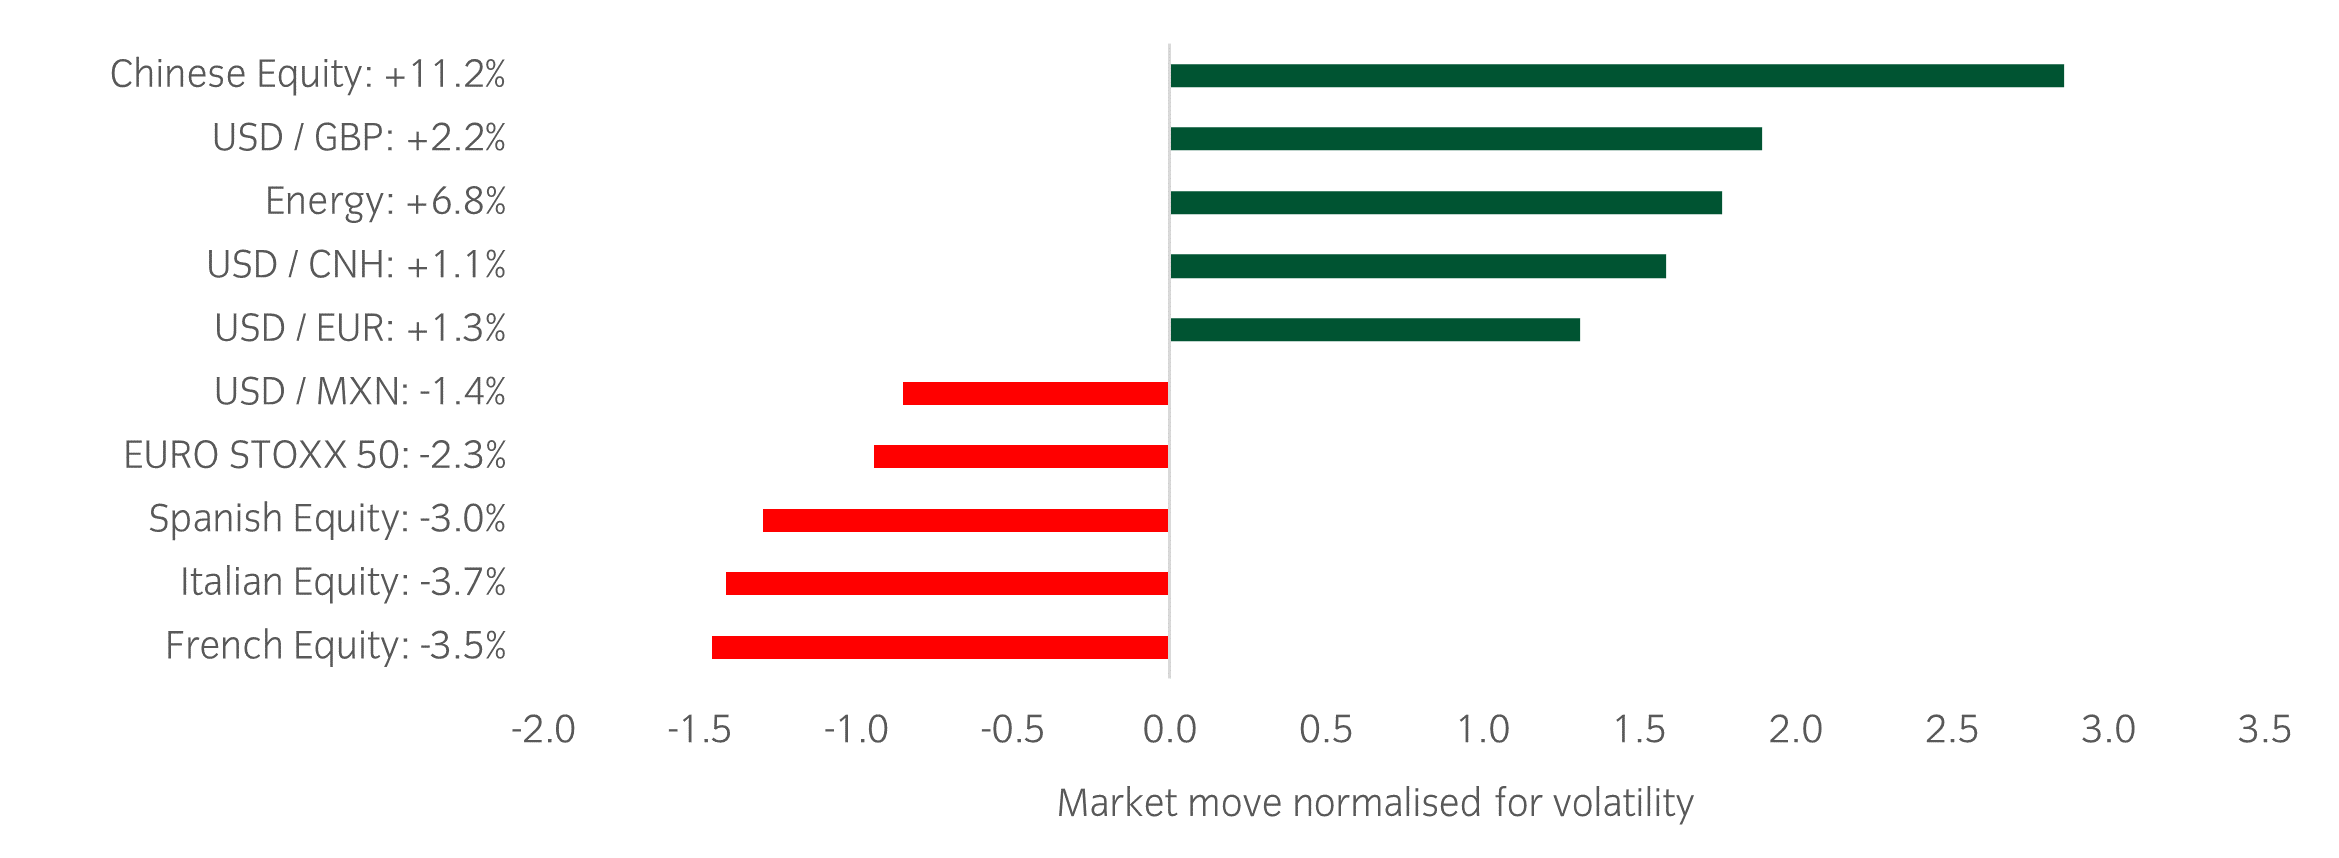
Source: Bloomberg and Insight as at 04 October 2024.The price movement of each asset is shown next to its name. The data used by the bar chart divides the price movement by the annualised historical volatility of each asset.
Over the past week, several things caught our eye:
- The latest US jobs report for September was unequivocally strong, following on from a strong September ISM services data which came in at a 19-month high. This has led markets to dial back the chances of a further 50bp rate cut from the Fed over the coming months, with 25 bps now the clear market expectation.
- Following a slew of policy initiatives announced by Chinese authorities last week, China-linked assets enjoyed a sharp rally. Chinese equities posted one of the strongest weekly returns in the past 25 years and now lead global equity markets in year-to-date returns. China’s listed property sector has rallied the most, more than doubling in the five days after the announcement.
- Geopolitical escalation in the Middle East caused a bounce in oil markets this week, with Brent and WTI surging 9%.
Winners & losers: European equities underperformed this week following a lower-than-expected PMI in the Eurozone and potential tariff impacts.
Asset allocation observation
Better seasonality into year end
Source: Insight and Bloomberg as at 04 October 2024.
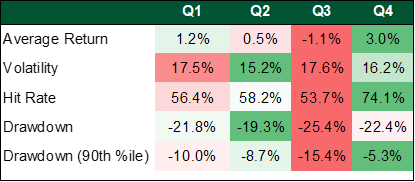
- Seasonally, the autumn has historically been a challenging time in markets with above average volatility, most notably in September. However, coming into the 4th quarter we enter a historically positive period for risk assets. A lot of hurdles lie in the way between now and year end though, with growth, the US presidential election, and geopolitical risks at the forefront.
- While we remain only marginally above our midpoint equity weight, we have chosen tactical upside option trades into year end with a focus on small caps, Asia, and emerging markets.
 Australia


