Australia


Chart of the week
Figure 1: Central bank pauses – cuts should be coming, but we’ll have to wait a little longer
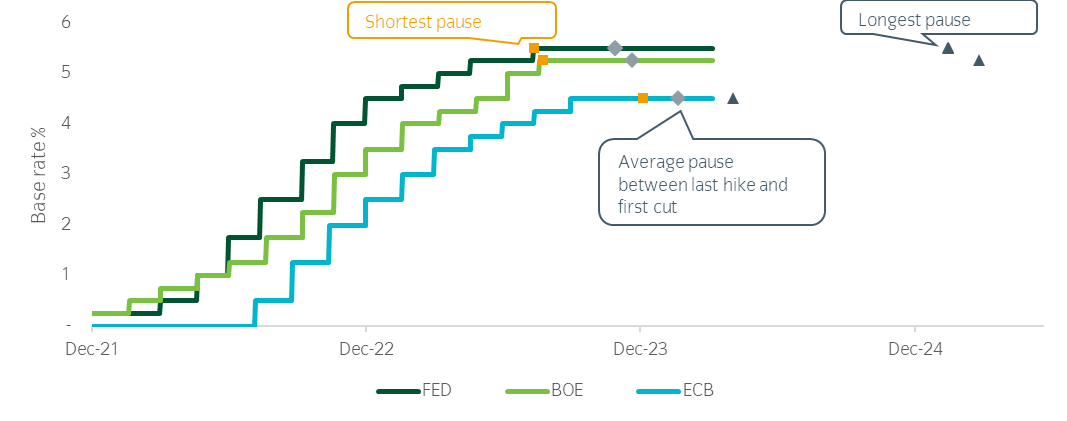
Source: Insight and Bloomberg. Data as at 22 March 2024.
- This has been a busy week for central bank meetings. The Bank of Japan grabbed the headlines by ending its negative interest rate policy after eight years but the price reaction of bonds, the yen and the stock market suggest the shift had been well telegraphed to the markets. The Swiss central bank delivered a surprise cut, but the Fed, the ECB and the Bank of England all held rates unchanged as expected.
- The Fed, the Bank of England and the ECB last raised rates in July, August, and September respectively in 2023. At the time they all signalled a period of stability was likely while waiting for confirmation of inflation reversing.
- Our chart of the week shows the length of the current central bank pause compared to history. In all cases, we’re well beyond an average pause. Historically, when central banks have had to cut quickly, it normally meant their economies were already hurting from the previous tightening cycle. This time around, they’ve held up better than expected – cuts should be coming, but we’ll have to wait a little longer.
Market watch
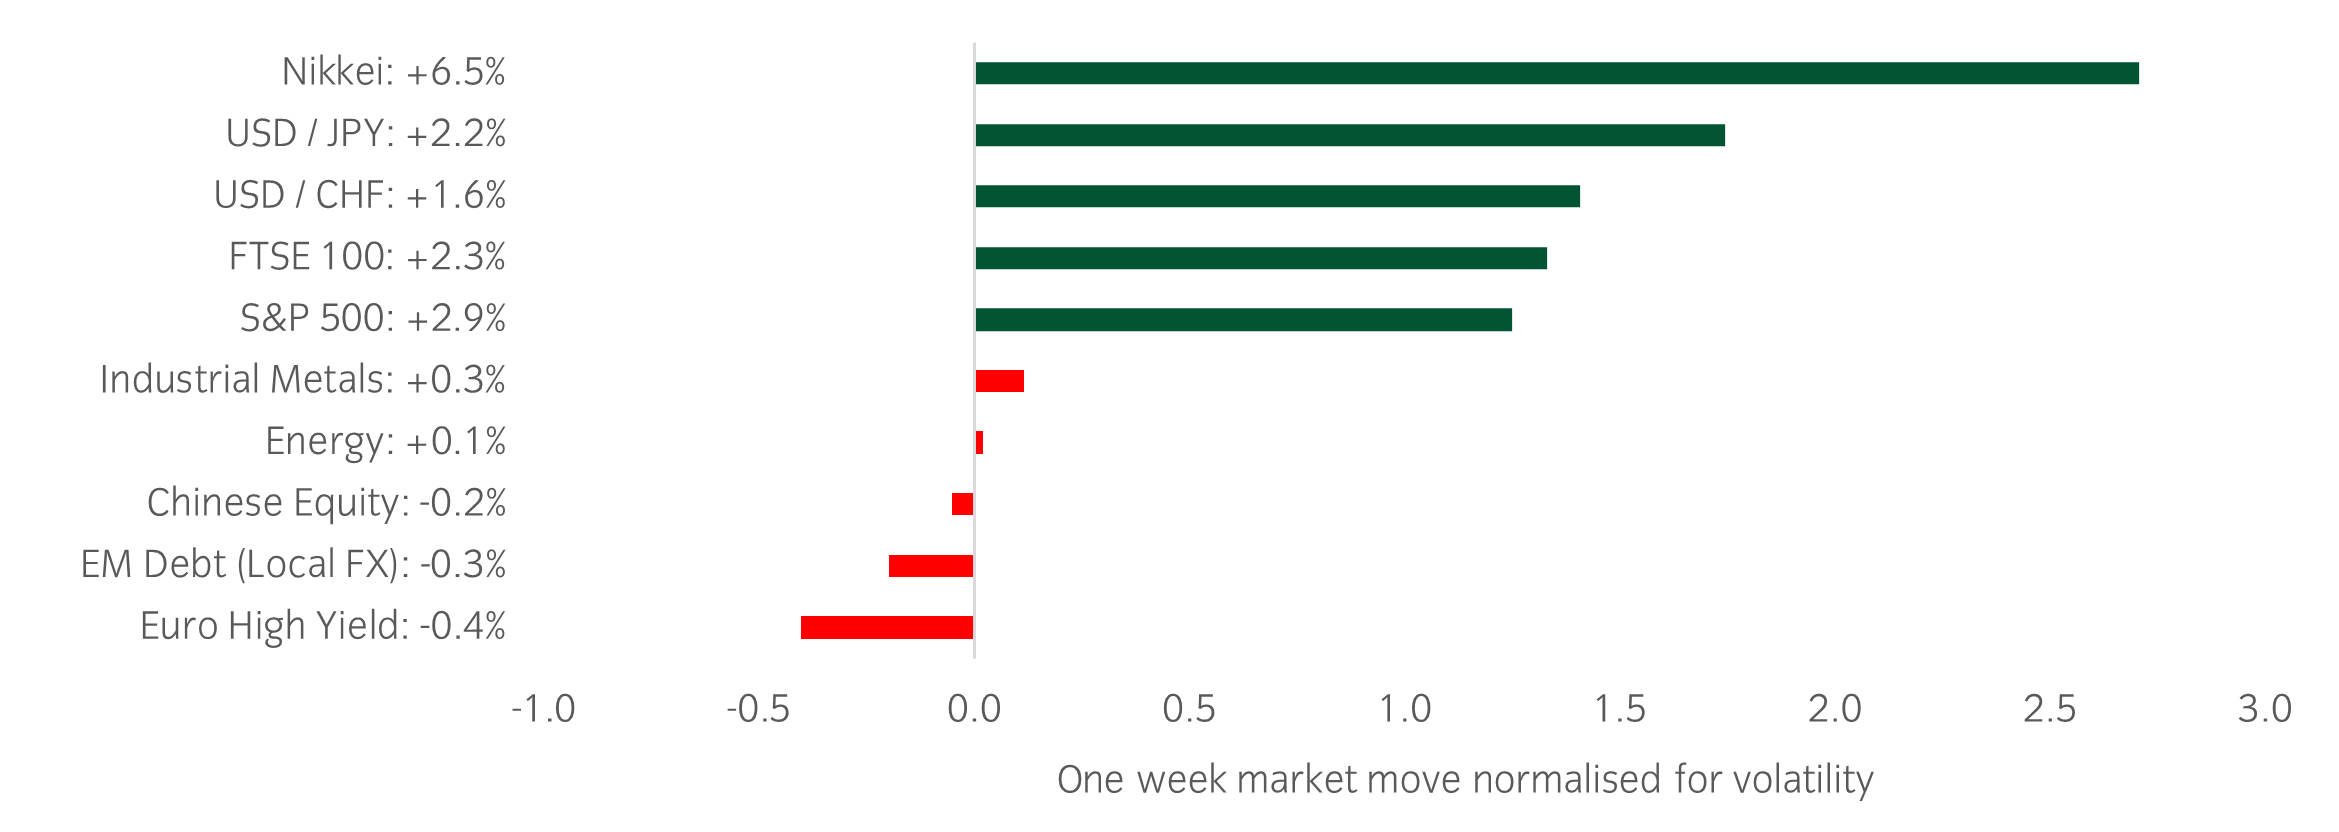
Source: Bloomberg and Insight as at 22 March 2024.The price movement of each asset is shown next to its name. The data used by the bar chart divides the price movement by the annualised historical volatility of each asset.
In a busy week with far too much to cover here, three things caught our eye:
- The Federal Open Market Committee (FOMC) met for the first time since the release of both January and February inflation data. Upside beats were not enough to dissuade the committee that the trend of inflation lower remains broadly on track, and so in line with rate cuts at some point this year. In fact, the median expectation is for 75 basis points of cuts in 2024, broadly in line with market expectations.
- Flash PMIs for March were released - while there are pockets of weakness, namely France and Germany, the broad picture remains supportive of a soft-landing scenario, not too hot as to reaccelerate inflation, and not too weak as to signal a recession.
- Chinese factory output and investment picked up at the start of this year with industrial production growing at the fastest rate in almost two years. The property sector continues to be a big drag and consumption remain subdued, but overall, the releases were better than expected. Will this reduce the need for additional stimulus? Our guess is no - more help will be needed if growth targets are to be hit.
Winners & losers: Given the Fed’s dovish tilt at their meeting there was a broad risk on rally, with equities higher and yields lower on the week. The clear winner was Japan, even after the Bank of Japan ended the longest ever period of negative interest rate policy. The event had been well flagged and the Nikkei 225 unwound the previous week’s losses to reach a new all-time high. Similarly, the yen weakened against the dollar, moving back to levels only seen last year and pre-1991.
Chart of the week
Figure 1: Core CPI for February does not support an early cut
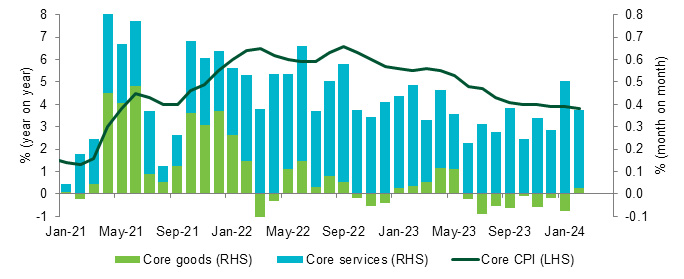
Source: Insight and Bloomberg. Data as at 14 March 2024.
- The release of February inflation data was the key focus of markets this week, and had increased significance following January’s outsized beat.
- Both headline and core CPI came in marginally hotter than expected but were less bad than the January data. Some of the details in the report were encouraging but overall, the data did not support a cut prior to the 12 June FOMC meeting.
- The chart of the week also highlights services as the key driver of inflation now, with goods prices flatlining.
Market watch
Three things that caught our eye this week.
- As mentioned above, the headlines this week were grabbed by inflation data. Firstly, US CPI came in hotter than expected on Tuesday, but reverted from a nasty January print. Then, the US PPI release on Thursday also came in above expectations at both a headline and core level. This has led economists to revise their forecasts higher to PCE, the Fed's preferred inflation measure, and a selloff in Treasuries that has left the 2-year yield near 4.7%.
- Japan remained in focus as the first round of the spring wage negotiations ended. Many workers have secured themselves the largest pay increases in three decades with an average increase of 5.3%. This has increased the probability that the Bank of Japan will end their negative interest rate policy at their meeting next week (market implied odds now at 56%).
- Winners & losers: Equity markets traded in a choppy fashion this week as investors grappled with the notion of stickier inflation and potentially fewer rate cuts from the Fed this year. The big losers were the Nikkei, given the possible end of negative interest rate policy (NIRP) and a stronger Yen, and US treasuries, given the hotter inflation data. The outperformers were Chinese equity, which continues to bounce from very depressed levels, and energy, with Brent crude briefly reaching $85 per barrel.
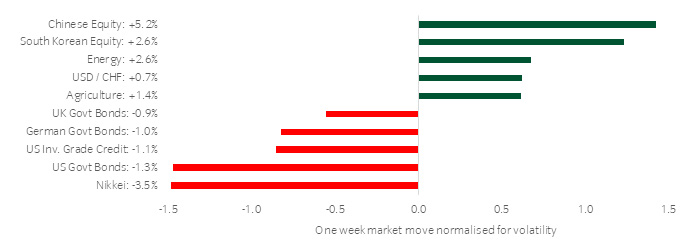
Source: Bloomberg and Insight as at 14 March 2024.The price movement of each asset is shown next to its name. The data used by the bar chart divides the price movement by the annualised historical volatility of each asset.
Chart of the week
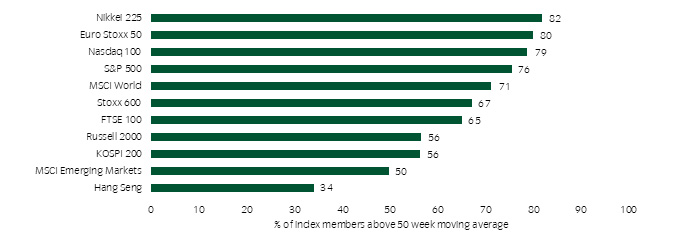
Figure 1: The broadening equity rally
Source: Insight and Bloomberg. Data as at 8 March 2024.
- Headlines around equity market performance have been grabbed by the ‘Magnificent 7’ and the “Artificial Intelligence” narrative.
- There is good reason for the narrative, as these stocks have led the way. Most stocks tend to lag their index when the mega caps are leading but, under the surface, market breadth is becoming healthier than the headlines suggest.
- In February, the equally weighted S&P500 posted a +4.2% return whilst the Russell 2000 rose over 5.5%. Indeed, as the chart of the week shows, most constituents are above their 50-week moving averages with the Nikkei 225 and Euro Stoxx 50 leading the way.
Market watch
A busy week - three things that caught our eye.
- Lots of growth data was released in the form of country purchasing manager indices (PMIs). Of the 30-manufacturing series we follow, 25 saw an improvement on a 3-month basis. The data on services is incomplete, but of the 18 releases we follow, all but one showed an improvement on the same basis. To be clear, this is no boom – but the stabilisation story seems intact.
- We often talk of how important wages are in the ongoing assessment of inflation. In Japan, wage growth rose at its fastest rate since June, while unions asked for an average wage rise of 5.85% at this year’s pay round – the biggest ask in 30-years. They won’t get that, but it brings the end of negative interest rate policy closer!
- Winners & losers: Global markets once again had a pro-risk tone over the week. Emerging market equities and credit markets outperformed, whilst the USD was soft. These moves were accompanied by a rally in US government bonds as both the Manufacturing and Service ISM PMIs came in below expectations.
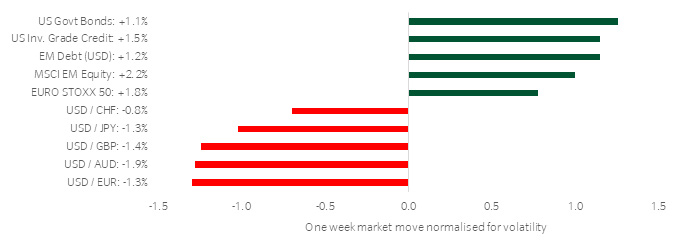
Source: Bloomberg and Insight as at 7 March 2024.The price movement of each asset is shown next to its name. The data used by the bar chart divides the price movement by the annualised historical volatility of each asset.
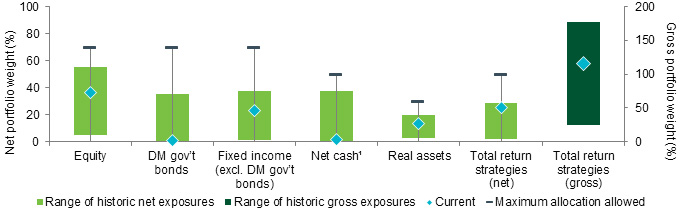
Asset allocation observation
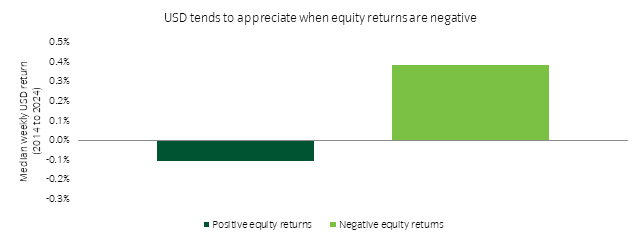
- The current high correlation across asset class movements is a challenge from a portfolio construction standpoint. That prompts us to look for diversifying strategies and here we put FX in the spotlight.
- Two of the risks we are mindful of are:
- A relapse in inflation
- Growth, most obviously in the US, does not moderate to a point where monetary easing is warranted
- In either case, US rate expectations would ratchet up which would support the US dollar. The greenback also tends to benefit from ‘risk-off’ episodes and such an adjustment in rate expectations may well trigger one. The challenge is timing – that is why we dynamically manage exposures using Insight’s ‘Flight to Safety’ FX strategy.
Summary
- As far as markets are concerned, the evolution of inflation remains centre stage. Already this year, US economic strength combined with sticky inflation prints in several countries means that although interest rate reductions are still on the cards they may begin later and be less aggressive than previously priced. Our chart of the week below highlights just how far market expectations for rate cuts in 2024 has changed this year.
- Markets are now pricing in a degree of easing much closer to central bank guidance. Several Fed speakers suggested that three US rate cuts are likely this year, while European Central Bank (ECB) President Lagarde noted the central bank needs confidence that inflation is “sustainably” back towards target before it can ease.
- Bond yields were slightly higher on the week, reflecting lower rate cut expectations. Equity markets have coped well with a more challenging fixed income backdrop as most markets continue to post positive returns. The S&P has risen in 16 of the last 18 weeks (at the time of writing) for the first time since 1971.
Chart of the week
Figure 1: Rate cut expectations have fallen sharply over the course of this year
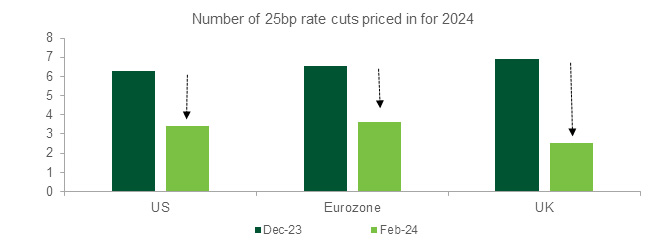
Source: Insight and Bloomberg. Data as at 01 March 2024.
Market events
- As noted above, the path of inflation remains critical for investors given the impact upon central bank policy rates and economic activity.
- This week saw the release of the Federal Reserve’s preferred measure of inflation (personal consumption expenditures), which slowed to 2.4% in January, the lowest level since February 2021. Rhetoric from regional Fed Presidents was also dovish, suggesting three US rate cuts were likely in 2024.
- The US labour market showed only modest signs of weakness, with initial jobless claims rising by 45k to 1.9m. The continued relative strength of the labour market supports the more positive cyclical outlook for US (and global) growth.
- Japanese inflation also fell, but by less than expected (2.2% vs 1.9%), further increasing the likelihood that the Bank of Japan will abandon its negative rate policy by April.
- The flash estimate for annual Eurozone inflation fell to 2.6% in February, as ECB President Lagarde indicated continued vigilance against ongoing wage pressures.
- Donald Trump appears to be leading the way so far for the Republican nomination; market implications remain unclear at this stage. US congressional leaders also agreed to a deal to avoid a partial government shutdown, pushing the deadline out to 8th March.
- Next week sees 'Super Tuesday' a key date in the race for who will be the next US Presidential candidates for the respective parties. From an economic perspective we will receive the latest US jobs report, the UK budget and the ECB’s latest policy meeting (no rate change expected). Corporate earnings season continues with the likes of Target and Costco reporting. In China, the National People’s Congress gets underway, with expectations for announcements on 2024 growth and policy responses.
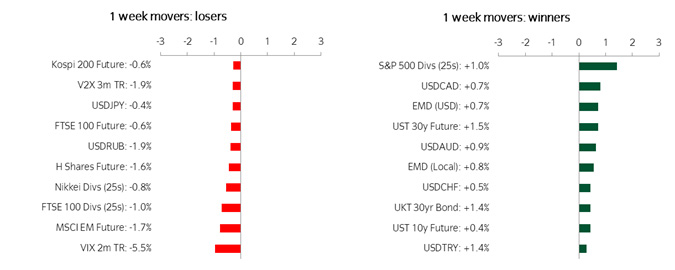
Source: Bloomberg and Insight as at 1 March 2024.The price movement of each asset is shown next to its name. The data used by the bar chart divides the price movement by the annualised historical volatility of each asset.
Figure 3: Rate cut expectations have fallen sharply over the course of this year